Hashtag

#openstreetmap

197 posts tagged with this hashtag.

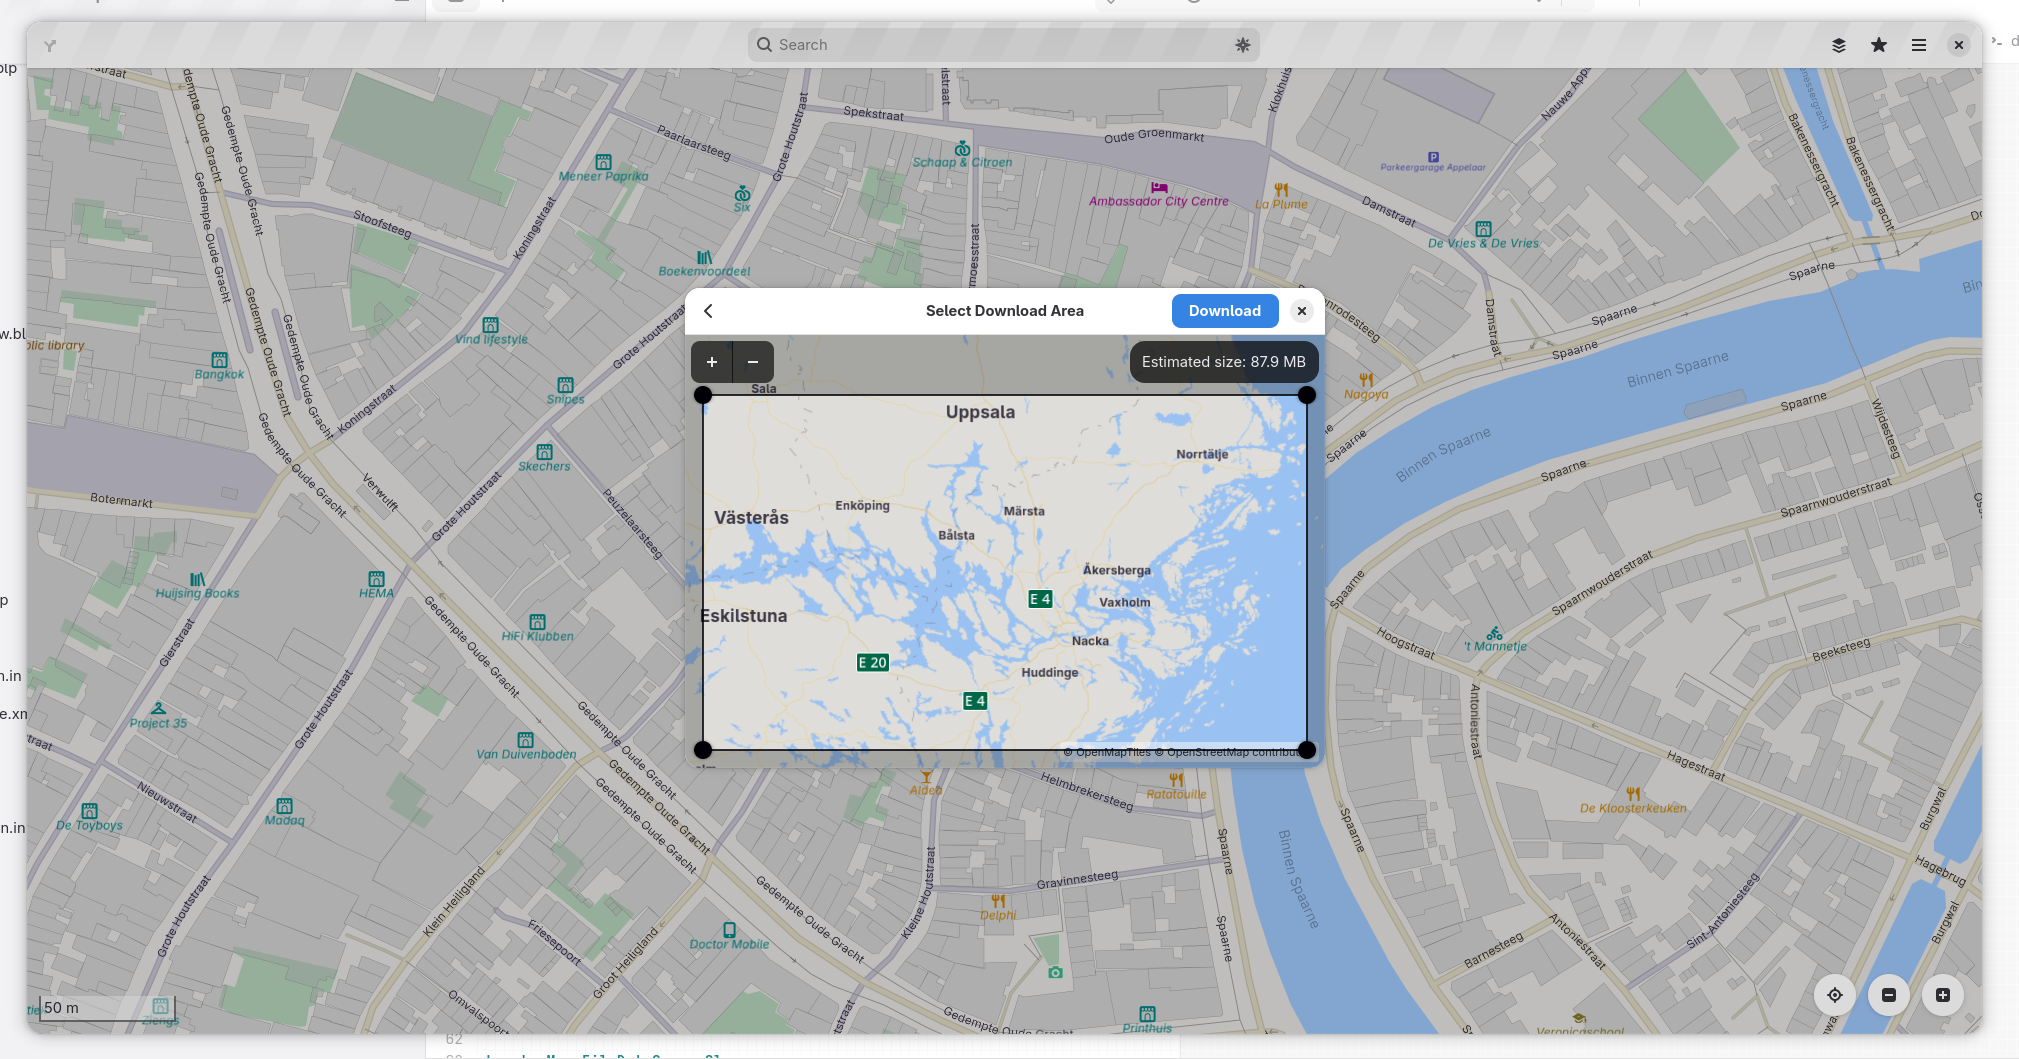
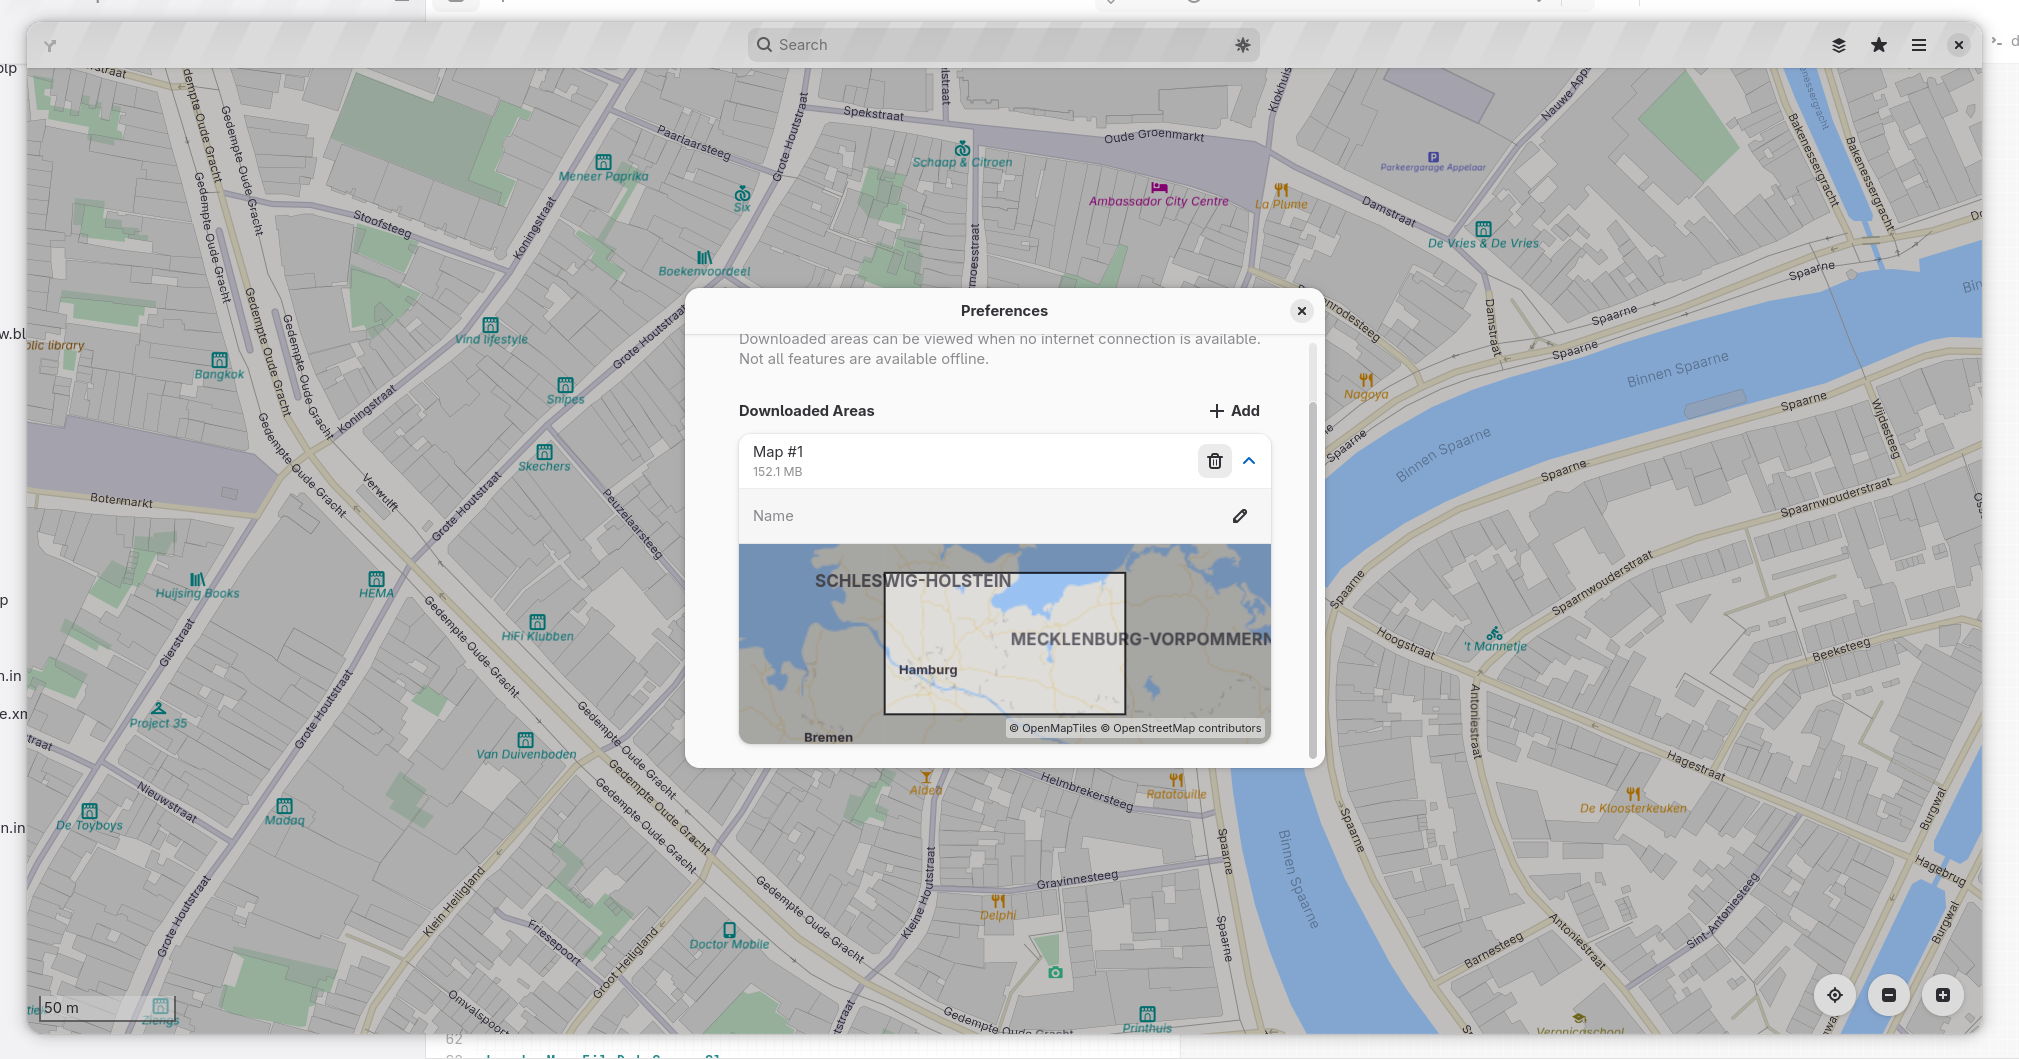
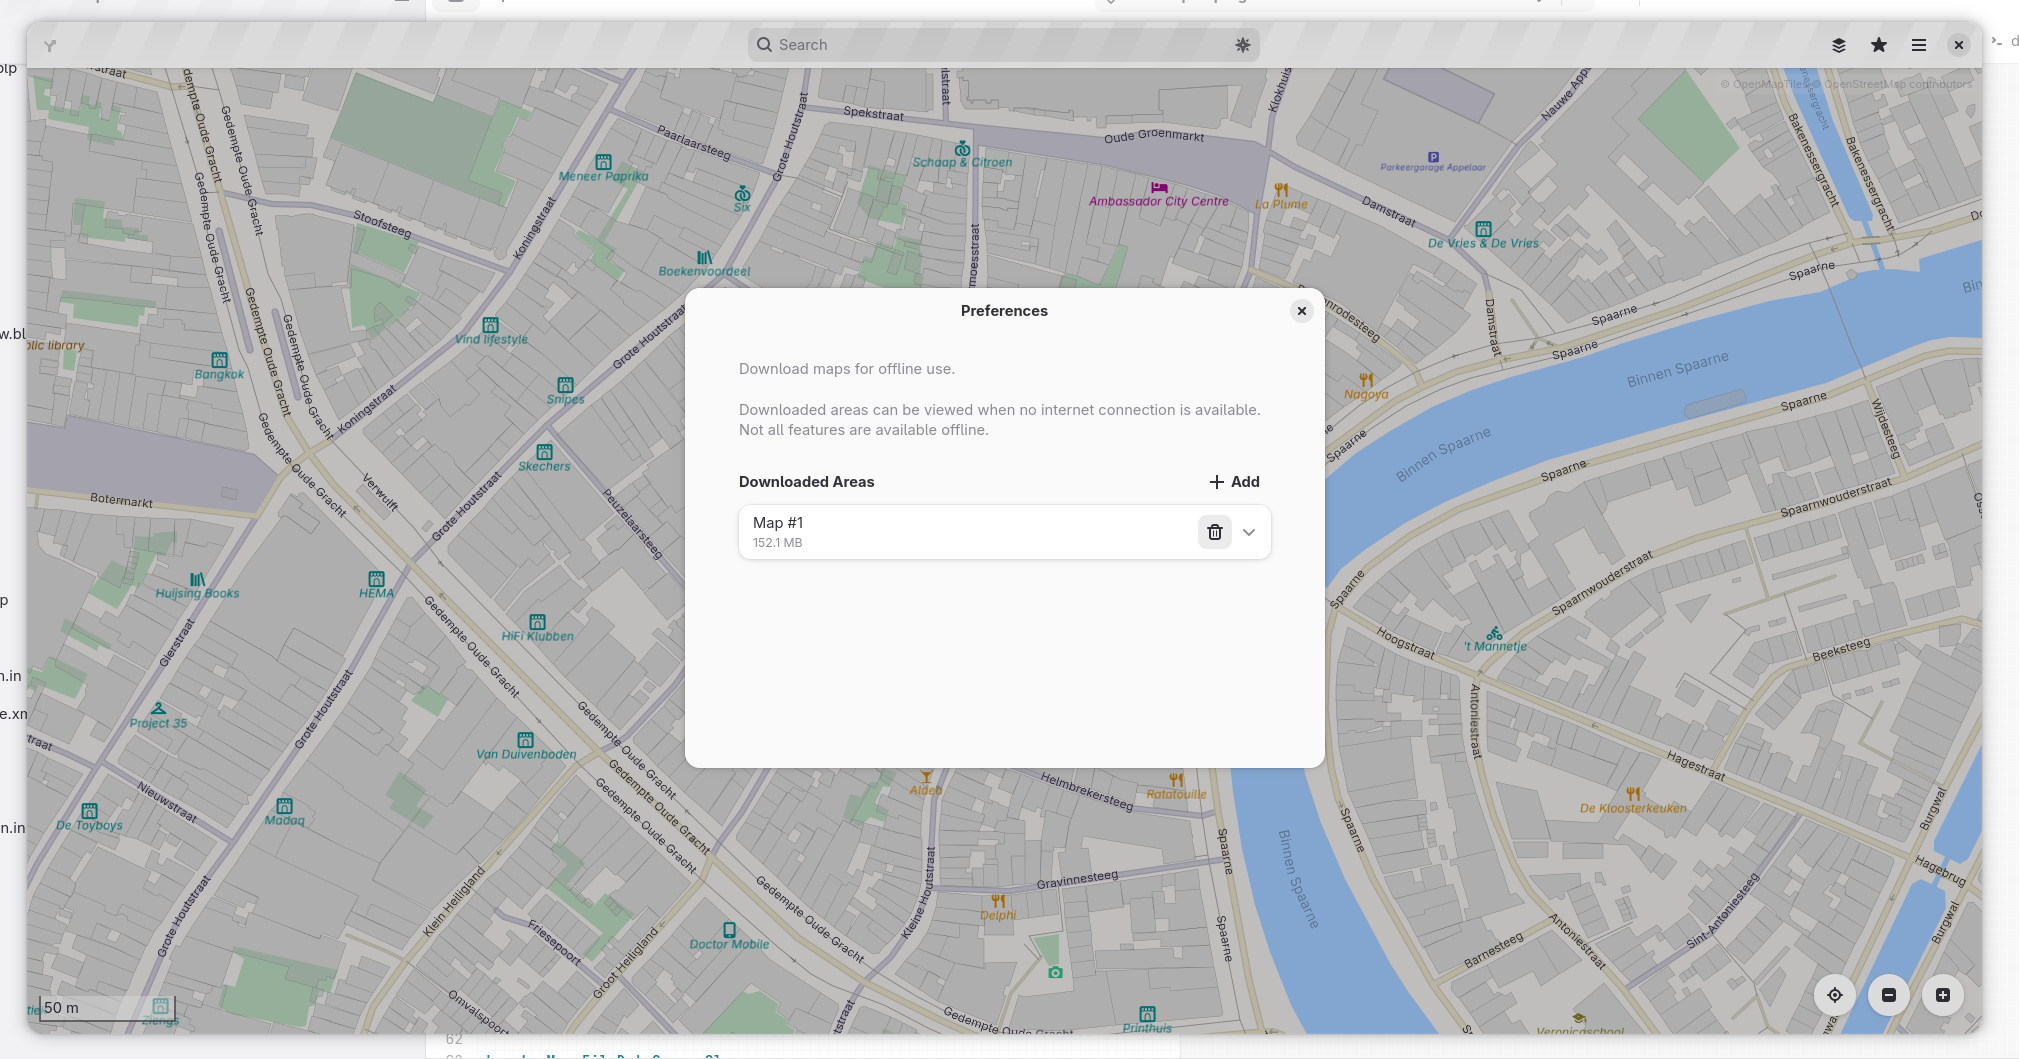
Thanks to hard work by @flyingpimonster Maps now supports downloading map areas for offline use!

This has been a long-awaited feature and will finally be available in GNOME 51.

GNOME Maps showing interface for downloading an area for offline use
ALT text

GNOME Maps showing interface for downloading an area for offline use

GNOME Maps showing list of downloaded map areas, with expanded view of one selected area, showing a minimap of that area.
ALT text

GNOME Maps showing list of downloaded map areas, with expanded view of one selected area, showing a minimap of that area.

GNOME Maps showing preference dialog with list of downloaded map areas and the option to download an additional area.
ALT text

GNOME Maps showing preference dialog with list of downloaded map areas and the option to download an additional area.

Thanks to hard work by @flyingpimonster Maps now supports downloading map areas for offline use!

This has been a long-awaited feature and will finally be available in GNOME 51.

GNOME Maps showing interface for downloading an area for offline use
ALT text

GNOME Maps showing interface for downloading an area for offline use

GNOME Maps showing list of downloaded map areas, with expanded view of one selected area, showing a minimap of that area.
ALT text

GNOME Maps showing list of downloaded map areas, with expanded view of one selected area, showing a minimap of that area.

GNOME Maps showing preference dialog with list of downloaded map areas and the option to download an additional area.
ALT text

GNOME Maps showing preference dialog with list of downloaded map areas and the option to download an additional area.

Thanks to hard work by @flyingpimonster Maps now supports downloading map areas for offline use!

This has been a long-awaited feature and will finally be available in GNOME 51.

GNOME Maps showing interface for downloading an area for offline use
ALT text

GNOME Maps showing interface for downloading an area for offline use

GNOME Maps showing list of downloaded map areas, with expanded view of one selected area, showing a minimap of that area.
ALT text

GNOME Maps showing list of downloaded map areas, with expanded view of one selected area, showing a minimap of that area.

GNOME Maps showing preference dialog with list of downloaded map areas and the option to download an additional area.
ALT text

GNOME Maps showing preference dialog with list of downloaded map areas and the option to download an additional area.

Thanks to hard work by @flyingpimonster Maps now supports downloading map areas for offline use!

This has been a long-awaited feature and will finally be available in GNOME 51.

GNOME Maps showing interface for downloading an area for offline use
ALT text

GNOME Maps showing interface for downloading an area for offline use

GNOME Maps showing list of downloaded map areas, with expanded view of one selected area, showing a minimap of that area.
ALT text

GNOME Maps showing list of downloaded map areas, with expanded view of one selected area, showing a minimap of that area.

GNOME Maps showing preference dialog with list of downloaded map areas and the option to download an additional area.
ALT text

GNOME Maps showing preference dialog with list of downloaded map areas and the option to download an additional area.

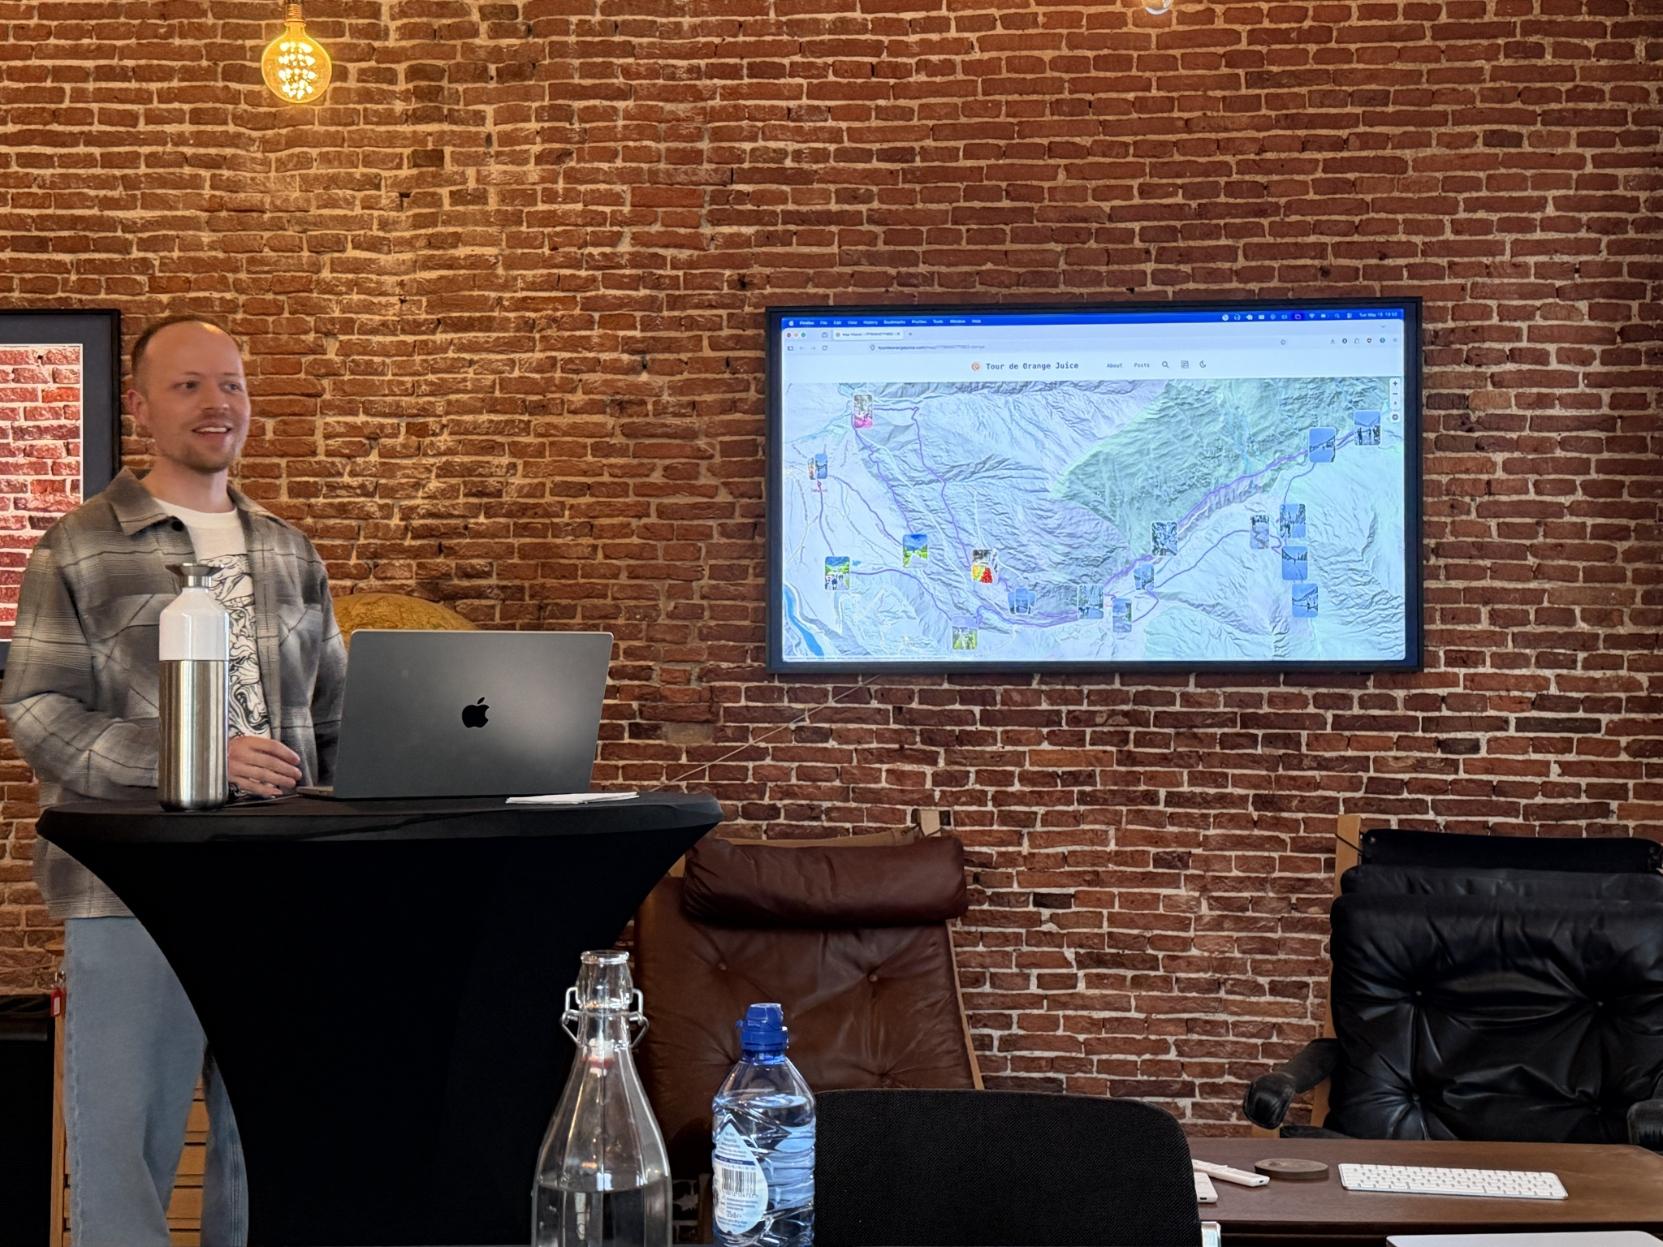
Wow I finally unlocked a ton of knowledge about displaying, styling, manipulating, and embedding maps today thanks to @bart!

I am going to use @maplibre GL JS everywhere from now on.

It’s so simple and fun that in a handful of minutes I managed to add a minimap to pages related to a specific place in my website 👀 (see this commit and this page as reference).

Thanks @internetarchiveeurope for having us 💕

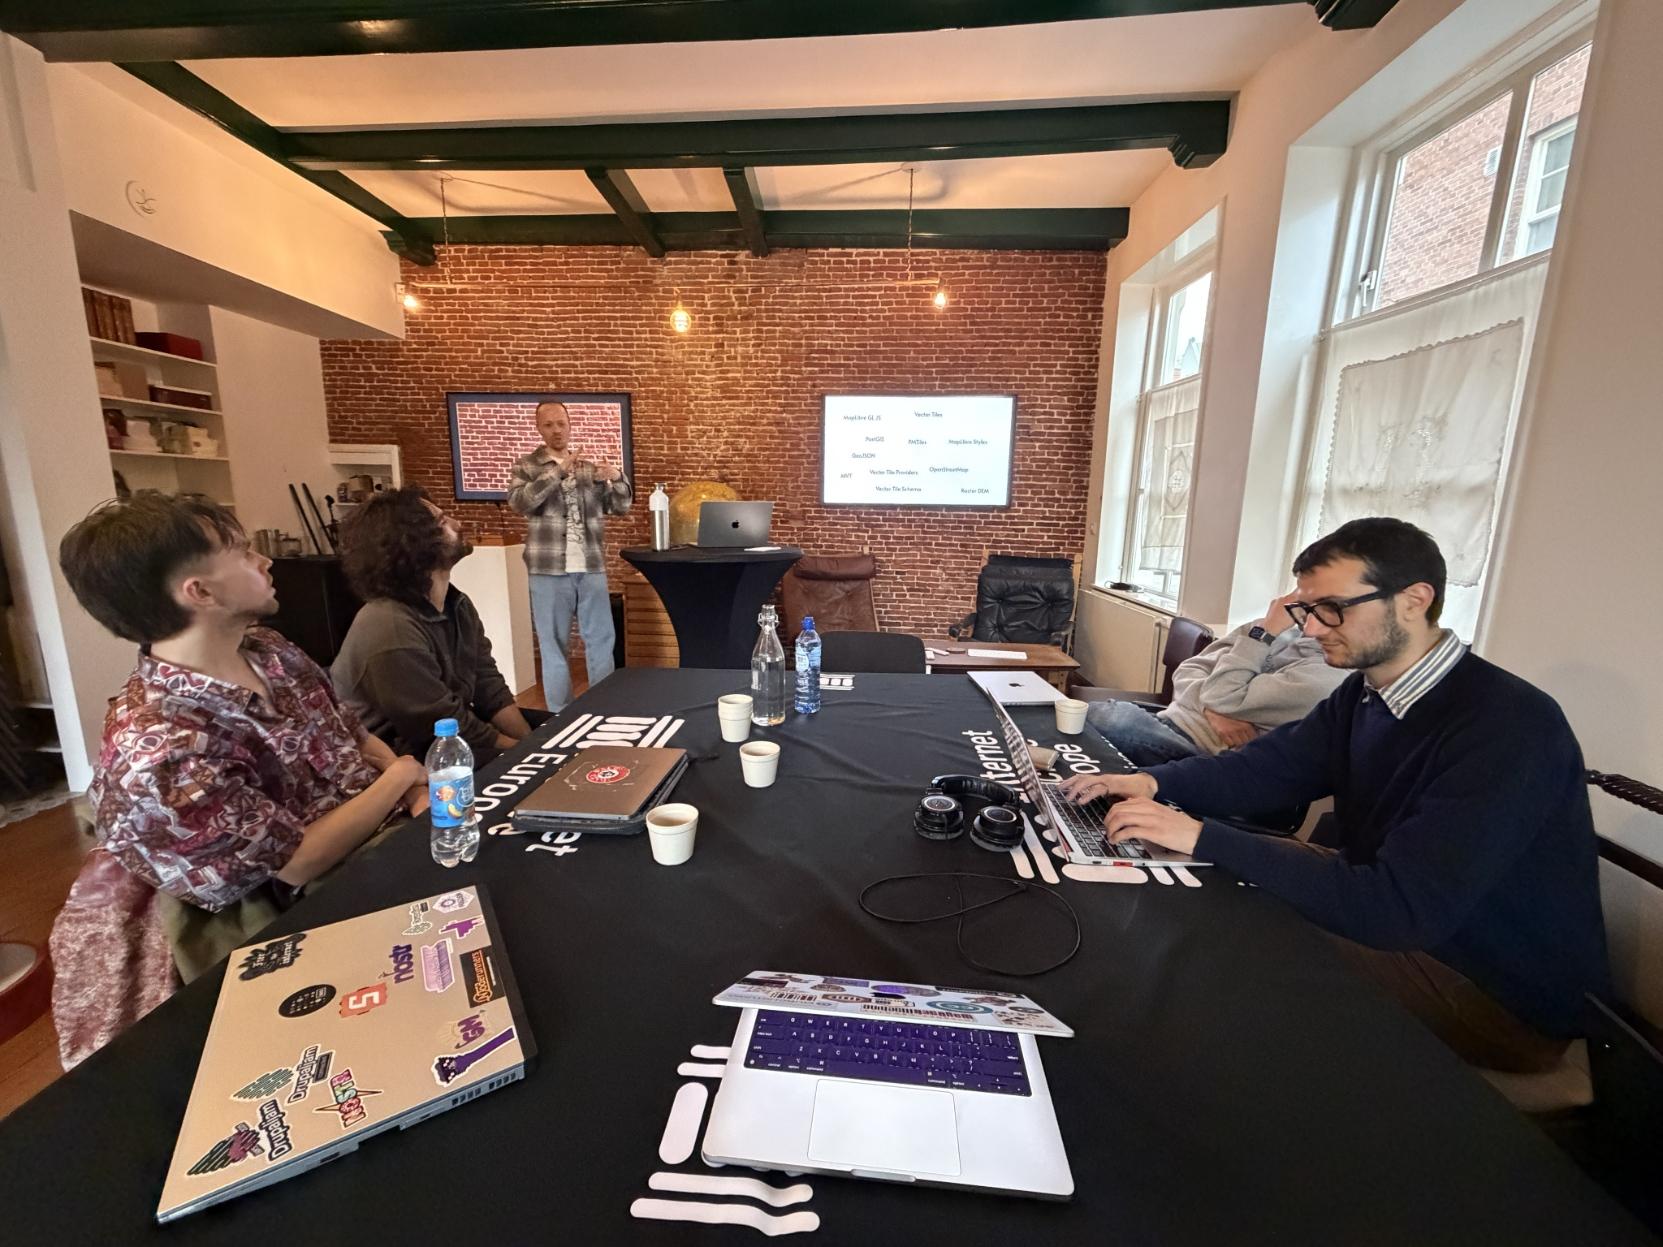
Bart presenting and sharing a nice project made with MapLibre
ALT text

Bart presenting and sharing a nice project made with MapLibre

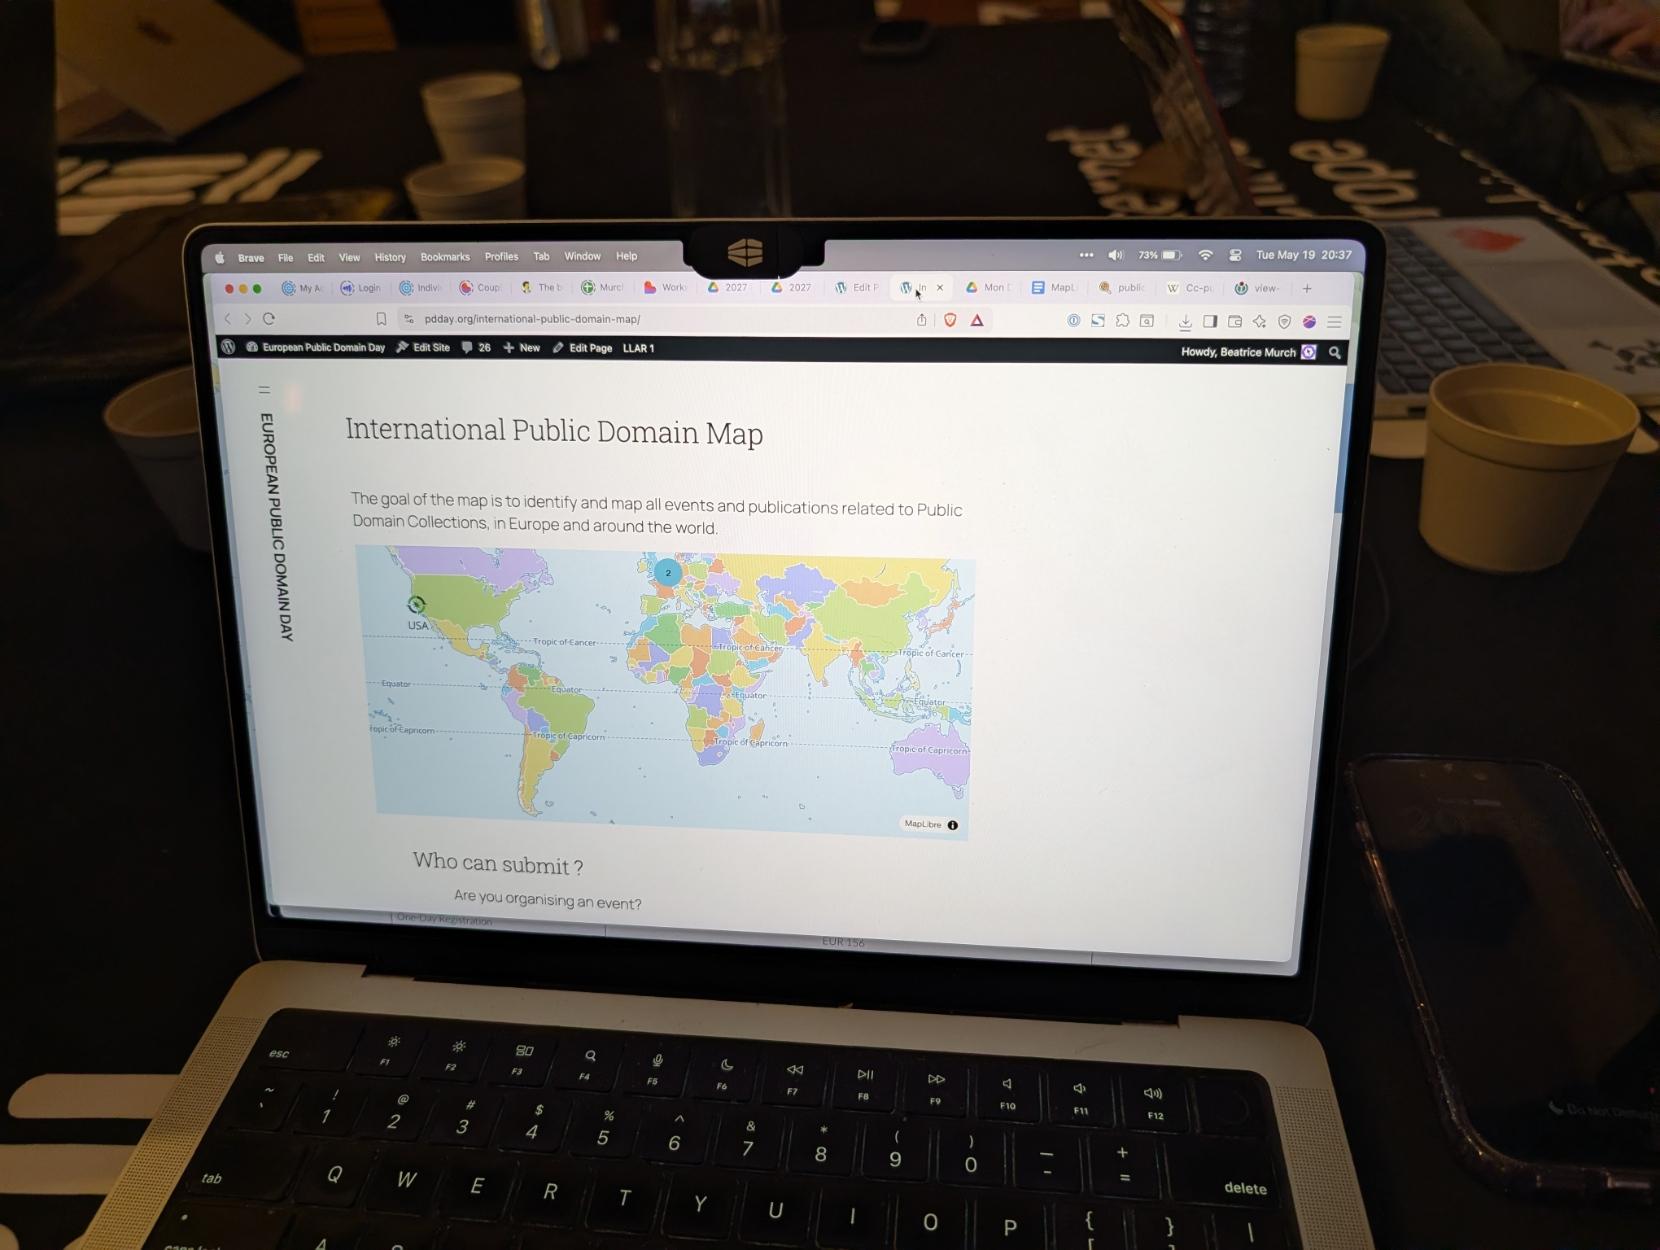
Photo of Beatrice’s screen, who used MapLibre to display the location of organizations that participate in the International Public Domain Day.
ALT text

Photo of Beatrice’s screen, who used MapLibre to display the location of organizations that participate in the International Public Domain Day.

Photo of some of the participants hacking while listening to Bart’s explanations.
ALT text

Photo of some of the participants hacking while listening to Bart’s explanations.

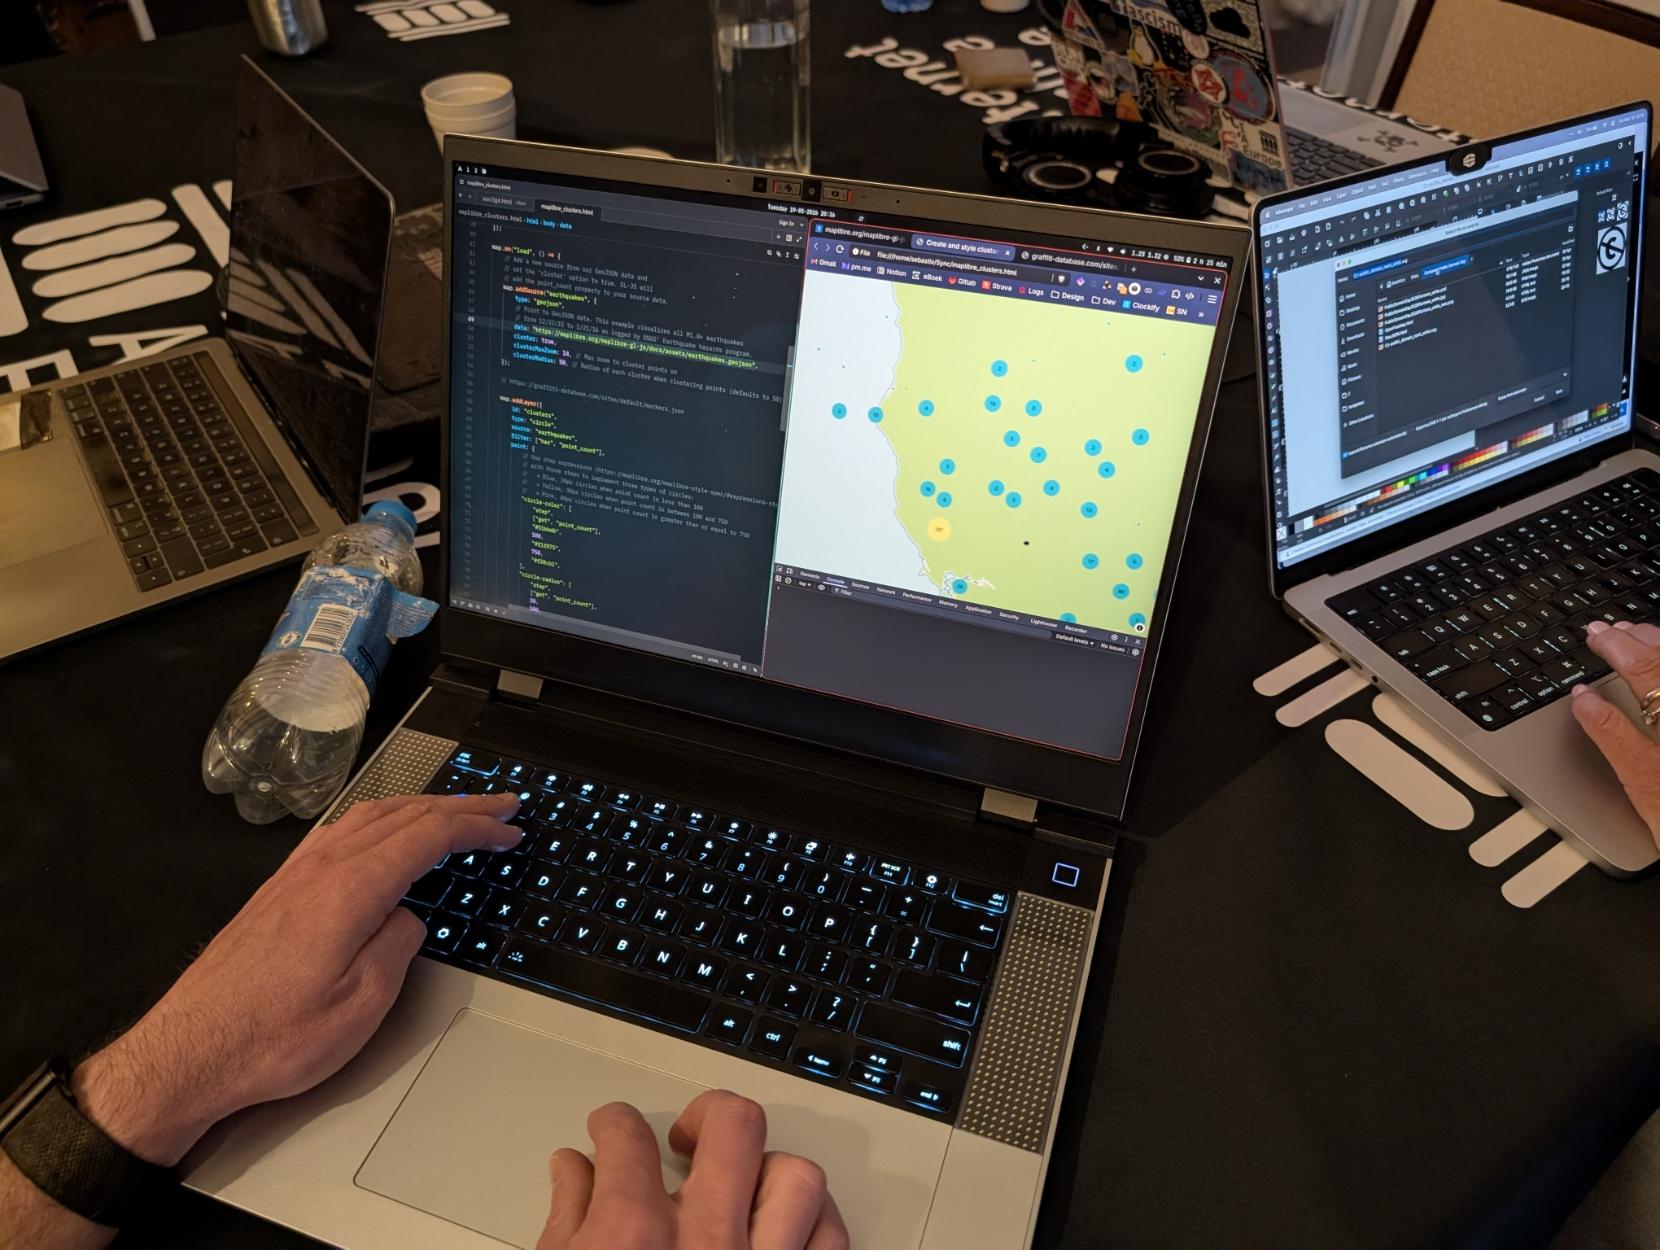
Earthquake map with MapLibre
ALT text

Earthquake map with MapLibre

Wow I finally unlocked a ton of knowledge about displaying, styling, manipulating, and embedding maps today thanks to @bart!

I am going to use @maplibre GL JS everywhere from now on.

It’s so simple and fun that in a handful of minutes I managed to add a minimap to pages related to a specific place in my website 👀 (see this commit and this page as reference).

Thanks @internetarchiveeurope for having us 💕

Bart presenting and sharing a nice project made with MapLibre
ALT text

Bart presenting and sharing a nice project made with MapLibre

Photo of Beatrice’s screen, who used MapLibre to display the location of organizations that participate in the International Public Domain Day.
ALT text

Photo of Beatrice’s screen, who used MapLibre to display the location of organizations that participate in the International Public Domain Day.

Photo of some of the participants hacking while listening to Bart’s explanations.
ALT text

Photo of some of the participants hacking while listening to Bart’s explanations.

Earthquake map with MapLibre
ALT text

Earthquake map with MapLibre

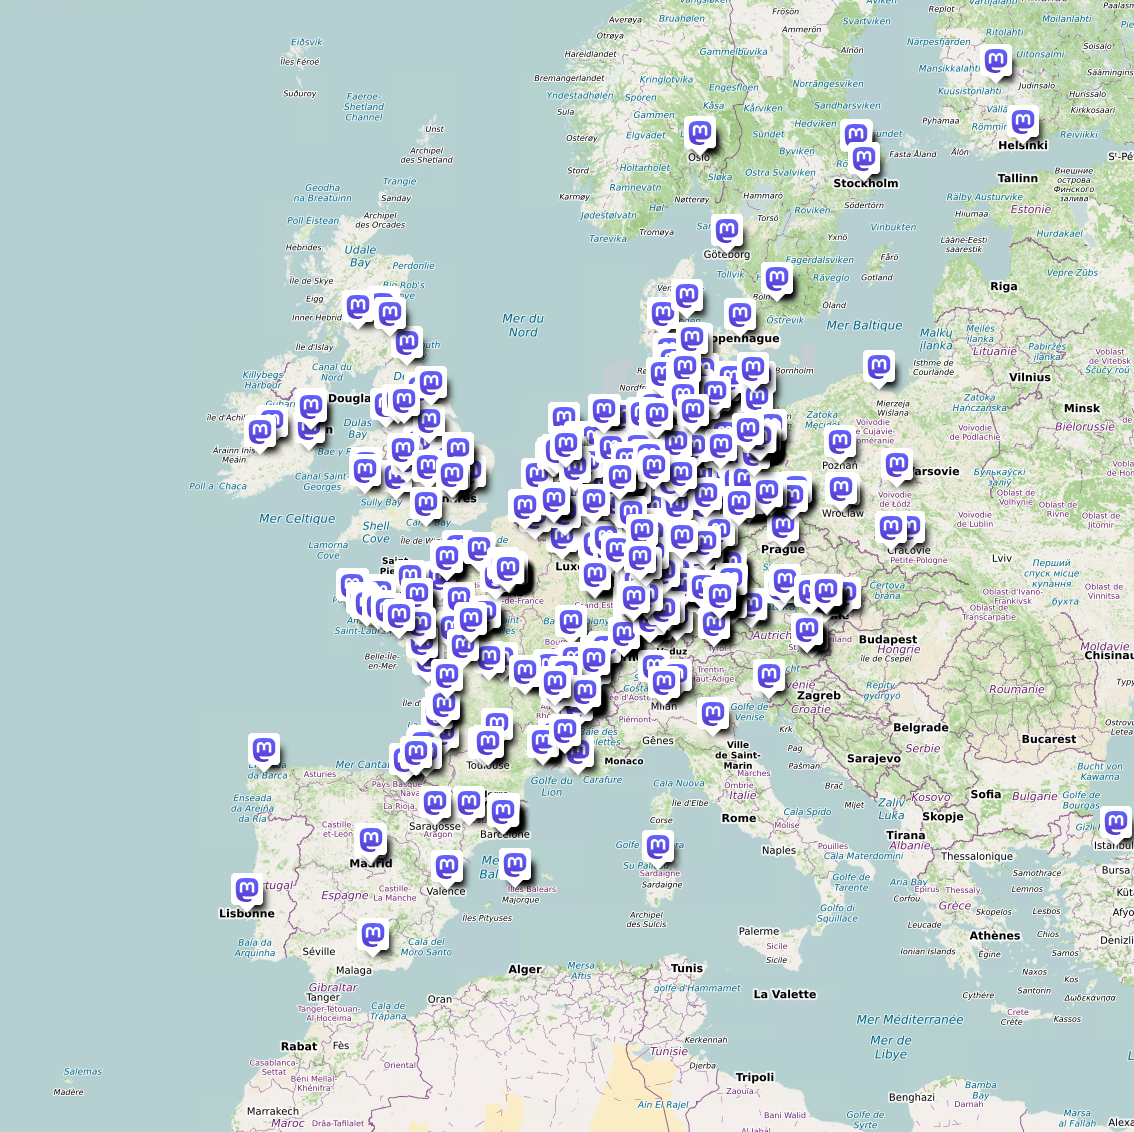
Hoo oooh, on vient de dépasser les 1000 lieux qui ont un compte Mastodon et sont présents dans OpenStreetMap !🥳
Ça commence à faire un p'tit annuaire sympa !
Parcourez-le sur cette carte uMap interactive➡️ umap.openstreetmap.fr/fr/map/l


Une carte d'Europe colorée où des centaines d'îcônes Mastodon sont parsemées.
ALT text

Une carte d'Europe colorée où des centaines d'îcônes Mastodon sont parsemées.

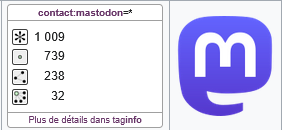
Un tableau TagInfo concernant la clé "contact:mastodon".
Il est renseigné que cette clé est présente 1009 fois au total dans OSM.
ALT text

Un tableau TagInfo concernant la clé "contact:mastodon". Il est renseigné que cette clé est présente 1009 fois au total dans OSM.

Parfois j'ai un problème de riche : c'est de trouver ce que je n'ai pas touché dans une zone pour faire correctement mon gif... heureusement que je ne touche pas aux POIs 😁 !

openstreetmap.org/#map=17/37.9

GIF animé d'une carte OpenStreetMap. L'ouest du centre-ville d'Achgabat au Turkménistan.

Première image : l'essentiel est déjà présent : les routes et les bâtiments sont déjà là, avec les POIs.

Deuxième image : les détails sont rajoutés : les arbres individuellement ou par zone arbres et d'herbe, les fontaines, les zones d'eau, les barrières et portails, les parkings. Tous les objets précédemment présents sont redessinées !
ALT text

GIF animé d'une carte OpenStreetMap. L'ouest du centre-ville d'Achgabat au Turkménistan. Première image : l'essentiel est déjà présent : les routes et les bâtiments sont déjà là, avec les POIs. Deuxième image : les détails sont rajoutés : les arbres individuellement ou par zone arbres et d'herbe, les fontaines, les zones d'eau, les barrières et portails, les parkings. Tous les objets précédemment présents sont redessinées !

Hoo oooh, on vient de dépasser les 1000 lieux qui ont un compte Mastodon et sont présents dans OpenStreetMap !🥳
Ça commence à faire un p'tit annuaire sympa !
Parcourez-le sur cette carte uMap interactive➡️ umap.openstreetmap.fr/fr/map/l


Une carte d'Europe colorée où des centaines d'îcônes Mastodon sont parsemées.
ALT text

Une carte d'Europe colorée où des centaines d'îcônes Mastodon sont parsemées.

Un tableau TagInfo concernant la clé "contact:mastodon".
Il est renseigné que cette clé est présente 1009 fois au total dans OSM.
ALT text

Un tableau TagInfo concernant la clé "contact:mastodon". Il est renseigné que cette clé est présente 1009 fois au total dans OSM.

GIF animé d'une carte OpenStreetMap. Parc Ak Saher dans le centre de Achgabat au Turkménistan.

Première image : Seulement le monument au centre, le contour du parc et quelques chemin piétons sont présent.

Deuxième image : les zones d'herbes apparaissent avec les fontaines, la totalité des chemins piétons et les arbres !
ALT text

GIF animé d'une carte OpenStreetMap. Parc Ak Saher dans le centre de Achgabat au Turkménistan. Première image : Seulement le monument au centre, le contour du parc et quelques chemin piétons sont présent. Deuxième image : les zones d'herbes apparaissent avec les fontaines, la totalité des chemins piétons et les arbres !

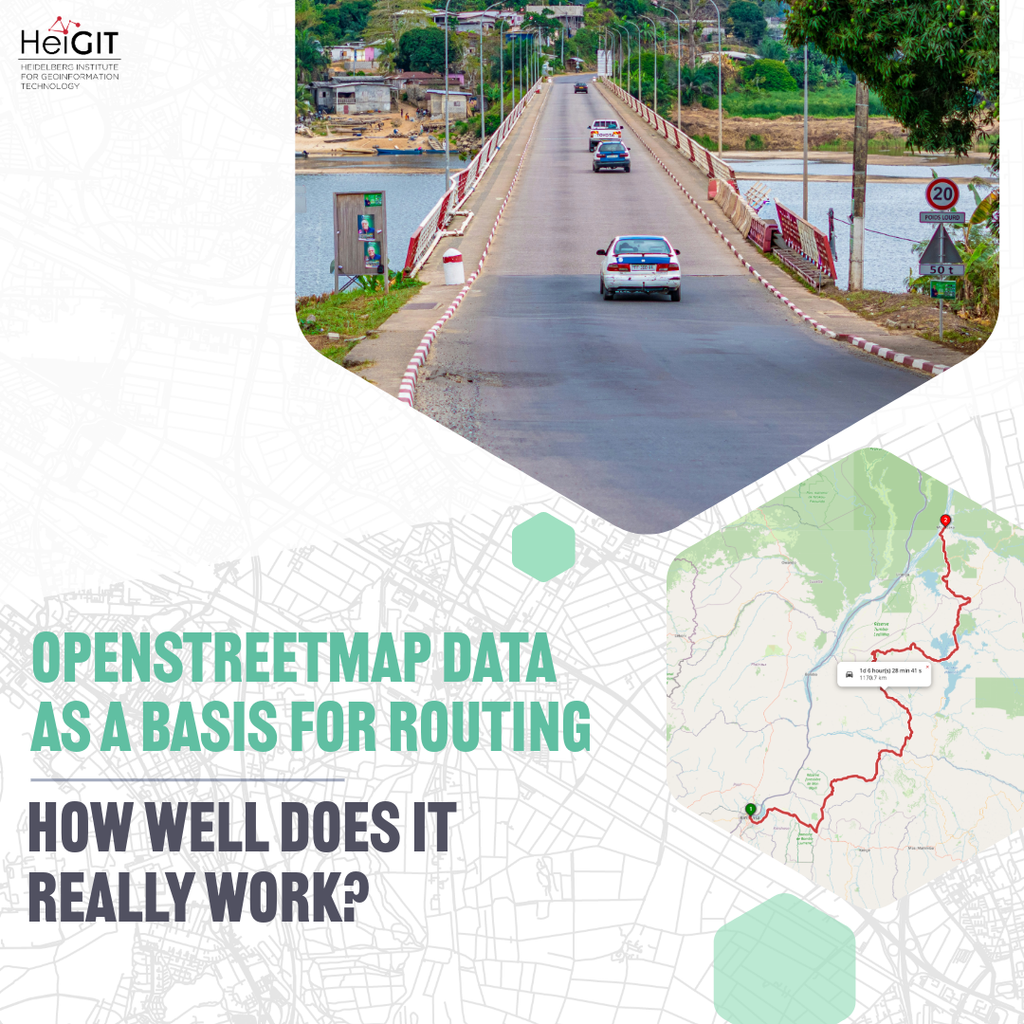
How reliable is data for routing? 🚙

In our tests with @BKG, OSM always finds a route, but the reliability of the data comes down to three factors: data availability, currentness, and route centrality.

In our latest blog post, we take a closer look at routing distance and travel time estimations and explain what drives the differences between OSM and commercial alternatives like Google Maps, with the help of the ohsome dashboard:

🔗 heigit.org/openstreetmap-data-

How reliable is data for routing? 🚙

In our tests with @BKG, OSM always finds a route, but the reliability of the data comes down to three factors: data availability, currentness, and route centrality.

In our latest blog post, we take a closer look at routing distance and travel time estimations and explain what drives the differences between OSM and commercial alternatives like Google Maps, with the help of the ohsome dashboard:

🔗 heigit.org/openstreetmap-data-

@HenriVerdier a inauguré mardi la commission d’enquête parlementaire sur nos dépendances et vulnérabilités numériques et tout y est très clairement exposé.

La perte de compétence qui fait qu’une DSI n’est plus composée que d’acheteurs qui ne comprennent plus ce qu’ils achètent.

Les communs comme rempart… mais utilisés sans réellement y participer et encore moins les financer.
et inside ;)

Grand merci, il nous faudrait plus d’Henri !

videos.assemblee-nationale.fr/

videos.assemblee-nationale.fr

Dépendances structurelles et vulnérabilités systémiques dans le secteur du numérique : M. Henri Verdier, directeur général de la fondation Inria ; M. David Chavalarias, directeur de recherche au CNRS et M. Robin Berjon, directeur de l’agence Supramundane - Mardi 10 mars 2026

13h00 : – Audition, ouverte à la presse, de M. Henri Verdier, ancien Ambassadeur pour le numérique et directeur général de la fondation Inria 14h00 : - Table ronde, ouverte à la presse, réunissant : - M. David Chavalarias, directeur de recherche au CNRS, directeur au Centre d’analyse et de mathématiques sociales de l’EHESS, et directeur de l’Institut des systèmes complexes de Paris Île-de-France (ISC-PIF) - M. Robin Berjon, informaticien, directeur de l’agence Supramundane - Mme Maud Quessard, directrice du domaine « Europe, Espace Transatlantique, Russie » à l’Institut de Recherche Stratégique de l’École Militaire (IRSEM)

@HenriVerdier a inauguré mardi la commission d’enquête parlementaire sur nos dépendances et vulnérabilités numériques et tout y est très clairement exposé.

La perte de compétence qui fait qu’une DSI n’est plus composée que d’acheteurs qui ne comprennent plus ce qu’ils achètent.

Les communs comme rempart… mais utilisés sans réellement y participer et encore moins les financer.

et inside ;)

Grand merci, il nous faudrait plus d’Henri !

videos.assemblee-nationale.fr/

videos.assemblee-nationale.fr

Dépendances structurelles et vulnérabilités systémiques dans le secteur du numérique : M. Henri Verdier, directeur général de la fondation Inria ; M. David Chavalarias, directeur de recherche au CNRS et M. Robin Berjon, directeur de l’agence Supramundane - Mardi 10 mars 2026
13h00 : – Audition, ouverte à la presse, de M. Henri Verdier, ancien Ambassadeur pour le numérique et directeur général de la fondation Inria 14h00 : - Table ronde, ouverte à la presse, réunissant : - M. David Chavalarias, directeur de recherche au CNRS, directeur au Centre d’analyse et de mathématiques sociales de l’EHESS, et directeur de l’Institut des systèmes complexes de Paris Île-de-France (ISC-PIF) - M. Robin Berjon, informaticien, directeur de l’agence Supramundane - Mme Maud Quessard, directrice du domaine « Europe, Espace Transatlantique, Russie » à l’Institut de Recherche Stratégique de l’École Militaire (IRSEM)

from one of my favorite DJs - Yotto.

His filmed sets are an absolute treat. Not only is the music great (and this time many unreleased tracks paired with his own remixes of others’ work), his goofy personality really comes out in the videos 🤪

This is probably my favorite of the “very cold DJ set” series already, given that I’ve watched it 3x in the past 24h lol. I’ve also added the location to my bucket list. It’s even well mapped in !

youtube.com/watch?v=TbloZ8rmux4

- YouTube

YouTube でお気に入りの動画や音楽を楽しみ、オリジナルのコンテンツをアップロードして友だちや家族、世界中の人たちと共有しましょう。

Aujourd'hui, je vous présente le micromapping d'un centre de rétablissement à Achgabat !

openstreetmap.org/#map=17/37.9

GIF animé d'une carte OpenStreetMap, cartographie du Complexe d'entraînement pour le rétablissement de la santé de Achagabat au Turkménistan. La zone est de forme semi-sphérique (pour les routes comme pour les bâtiments).

Première image, les routes et les bâtiments sont présents ainsi que la zone du complexe, mais toutes les formes sont peu précises.

Deuxième image : les bâtiments et les routes sont redessinées, la barrière tout autour du complexe, les zones d'herbes, les arbres, les zones de jeu et le terrain de sport, ainsi que tous les trottoirs à l'intérieur du complexe et aux abords proches apparaissent !
ALT text

GIF animé d'une carte OpenStreetMap, cartographie du Complexe d'entraînement pour le rétablissement de la santé de Achagabat au Turkménistan. La zone est de forme semi-sphérique (pour les routes comme pour les bâtiments). Première image, les routes et les bâtiments sont présents ainsi que la zone du complexe, mais toutes les formes sont peu précises. Deuxième image : les bâtiments et les routes sont redessinées, la barrière tout autour du complexe, les zones d'herbes, les arbres, les zones de jeu et le terrain de sport, ainsi que tous les trottoirs à l'intérieur du complexe et aux abords proches apparaissent !

Carto assez satisfaisante. J'aurais mis le temps avant d'ajouter les arbres... je traine toujours pour ajouter les arbres (là j'ai procrastiné 8 mois 🤭).

openstreetmap.org/#map=17/37.8

GIF animé d'une carte OpenStreetMap, du quartier résidentiel de Parahat 7/4 à Achgabat, la capitale du Turkménistan.

Première image : Tous les bâtiments, toutes les routes, touts les écoles, les principaux parking, sont déjà présentes grâce au super travail de apm-wa (https://www.openstreetmap.org/user/apm-wa; aka https://en.wikipedia.org/wiki/Allan_Mustard).

Deuxième image : Les bâtiments et les routes sont redessinées, j'y ajoute les zones d'herbes et de nombreux arbres, ainsi que des parkings, des zones de jeux pour enfants, des terrains de sport, et des barrières.
ALT text

GIF animé d'une carte OpenStreetMap, du quartier résidentiel de Parahat 7/4 à Achgabat, la capitale du Turkménistan. Première image : Tous les bâtiments, toutes les routes, touts les écoles, les principaux parking, sont déjà présentes grâce au super travail de apm-wa (https://www.openstreetmap.org/user/apm-wa; aka https://en.wikipedia.org/wiki/Allan_Mustard). Deuxième image : Les bâtiments et les routes sont redessinées, j'y ajoute les zones d'herbes et de nombreux arbres, ainsi que des parkings, des zones de jeux pour enfants, des terrains de sport, et des barrières.

I just applied for an @OpenStreetMapUS camera grant. The deal is that they loan you a GoPro Max and you collect street-level imagery, to be uploaded to Mapillary (required) or @panoramax to support the OSM mission. I think I applied a few years ago and wasn't selected. We'll see how it goes this time. I have a DJI action cam, but because it doesn't have GPS built in, the workflow to generate imagery with location metadata is too involved. blog.mapillary.com/update/2025

@Koreller @cartocite

1er année pour moi sur Saint-Nazaire :

🛣️ 176 km de rues cumulées
📸 20 196 photos 360° prises
🎬 110 séquences
🕝 10 jours de capture étalés sur le mois d’août.

api.panoramax.xyz/?focus=map&m

GIF animé d'une carte OpenStreetMap de Saint-Nazaire, avec la couverture Panoramax en 360 degrés filtré par l'utilisateur Vincenttux.
ALT text

GIF animé d'une carte OpenStreetMap de Saint-Nazaire, avec la couverture Panoramax en 360 degrés filtré par l'utilisateur Vincenttux.

@Koreller @cartocite

1er année pour moi sur Saint-Nazaire :

🛣️ 176 km de rues cumulées
📸 20 196 photos 360° prises
🎬 110 séquences
🕝 10 jours de capture étalés sur le mois d’août.

api.panoramax.xyz/?focus=map&m

GIF animé d'une carte OpenStreetMap de Saint-Nazaire, avec la couverture Panoramax en 360 degrés filtré par l'utilisateur Vincenttux.
ALT text

GIF animé d'une carte OpenStreetMap de Saint-Nazaire, avec la couverture Panoramax en 360 degrés filtré par l'utilisateur Vincenttux.

Cette année encore j'ai pu faire du Panoramax, niveau stats voilà ce que ça donne :

🛣️ 587 km de rues cumulées
📸 62000 photos prises en vélo
🎬 73 séquences
🕝 11 jours de capture

Merci encore pour le prêt du kit mobile [email protected] (de @cartocite) !

api.panoramax.xyz/?date_from=2

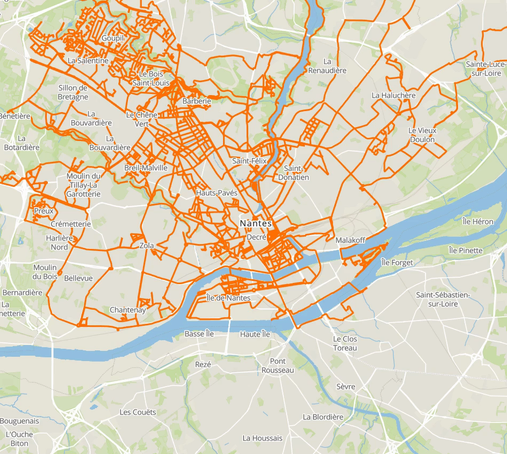
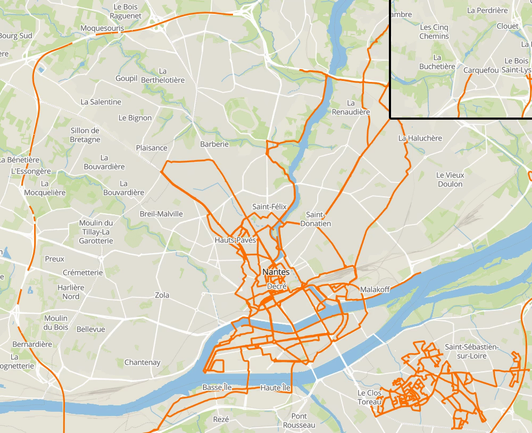
GIF animé d'une carte OpenStreetMap de Nantes, avec la couverture Panoramax en 360 degrés filtré par l'utilisateur Koreller.
Première image : une partie de la ville de Nantes est en déjà en 360 degrés.

Deuxième image : Une plus grande partie de Nantes, et une petite partie sud Loire sont disponible en 360 degrés !
ALT text

GIF animé d'une carte OpenStreetMap de Nantes, avec la couverture Panoramax en 360 degrés filtré par l'utilisateur Koreller. Première image : une partie de la ville de Nantes est en déjà en 360 degrés. Deuxième image : Une plus grande partie de Nantes, et une petite partie sud Loire sont disponible en 360 degrés !

C'est rare mais ça arrive.... voilà une contribution que j'ai fait en France !

Bon, ce que je préfère, et ça ce voit aussi ici, c'est quand même lorsqu'il n'y a pas grand chose avant 😉

openstreetmap.org/#map=19/48.8

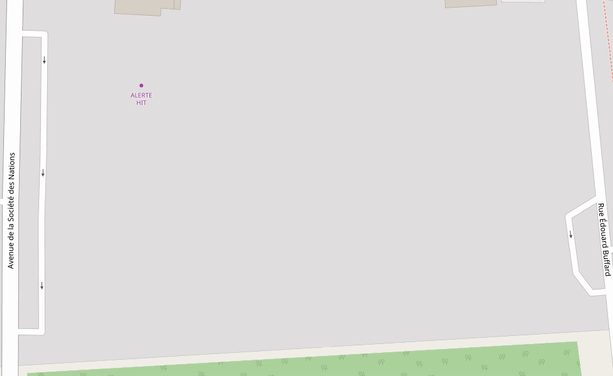
GIF animé d'une carte OpenStreetMap dans la ville de Montévrain, à l'est de Paris, en France.

Première image : il n'y a pas de bâtiment, la zone est déjà dans une zone résidentielle, il y a uniquement les routes sur les bord gauche et droite de l'image, et un seul POI (Alerte Hit).

Deuxième image : tous les bâtiments, les chemins piétons, les zones d'herbe, les arbres individuellement, les places de parking et les zones de parking apparaissent. Les boutiques autour des deux bâtiments centraux de la place, les adresses dans la zone et le nom du quartier "Carré M", sont ajoutés.
ALT text

GIF animé d'une carte OpenStreetMap dans la ville de Montévrain, à l'est de Paris, en France. Première image : il n'y a pas de bâtiment, la zone est déjà dans une zone résidentielle, il y a uniquement les routes sur les bord gauche et droite de l'image, et un seul POI (Alerte Hit). Deuxième image : tous les bâtiments, les chemins piétons, les zones d'herbe, les arbres individuellement, les places de parking et les zones de parking apparaissent. Les boutiques autour des deux bâtiments centraux de la place, les adresses dans la zone et le nom du quartier "Carré M", sont ajoutés.

C'est rare mais ça arrive.... voilà une contribution que j'ai fait en France !

Bon, ce que je préfère, et ça ce voit aussi ici, c'est quand même lorsqu'il n'y a pas grand chose avant 😉

openstreetmap.org/#map=19/48.8

GIF animé d'une carte OpenStreetMap dans la ville de Montévrain, à l'est de Paris, en France.

Première image : il n'y a pas de bâtiment, la zone est déjà dans une zone résidentielle, il y a uniquement les routes sur les bord gauche et droite de l'image, et un seul POI (Alerte Hit).

Deuxième image : tous les bâtiments, les chemins piétons, les zones d'herbe, les arbres individuellement, les places de parking et les zones de parking apparaissent. Les boutiques autour des deux bâtiments centraux de la place, les adresses dans la zone et le nom du quartier "Carré M", sont ajoutés.
ALT text

GIF animé d'une carte OpenStreetMap dans la ville de Montévrain, à l'est de Paris, en France. Première image : il n'y a pas de bâtiment, la zone est déjà dans une zone résidentielle, il y a uniquement les routes sur les bord gauche et droite de l'image, et un seul POI (Alerte Hit). Deuxième image : tous les bâtiments, les chemins piétons, les zones d'herbe, les arbres individuellement, les places de parking et les zones de parking apparaissent. Les boutiques autour des deux bâtiments centraux de la place, les adresses dans la zone et le nom du quartier "Carré M", sont ajoutés.

I just applied for an @OpenStreetMapUS camera grant. The deal is that they loan you a GoPro Max and you collect street-level imagery, to be uploaded to Mapillary (required) or @panoramax to support the OSM mission. I think I applied a few years ago and wasn't selected. We'll see how it goes this time. I have a DJI action cam, but because it doesn't have GPS built in, the workflow to generate imagery with location metadata is too involved. blog.mapillary.com/update/2025

Do you actively use ? Yes? Great!

Do you support OpenStreetMap? By active editing? Cool.

Did you know you can become a paying member and support other activities with your contribution?

I just renewed my membership. You can do so, too.

supporting.openstreetmap.org/#

supporting.openstreetmap.org

OpenStreetMap Foundation – Supporting the work of the OpenStreetMap project

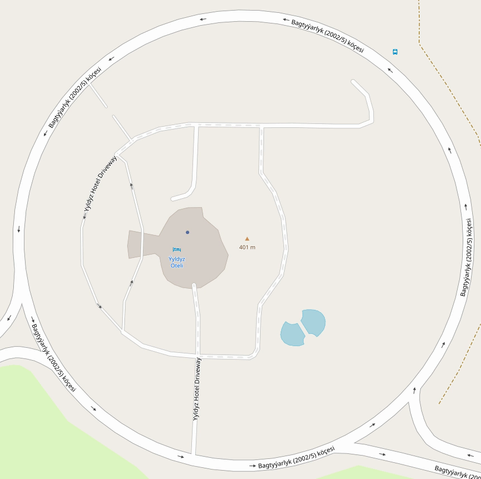
GIF animé d'une carte OpenStreetMap de l'hôtel Yydlyz, à Achgabat au Turkménistan.

Première image : la route circulaire, une partie du bâtiment central et certaines routes de services sont présentes.

Deuxième image : tous les objets sont redessinées, le bâtiment centrale prend son emprise réelle, les barrières, les deux terrain de sport au sud, tous les arbres et zone d'herbe apparaissent !
ALT text

GIF animé d'une carte OpenStreetMap de l'hôtel Yydlyz, à Achgabat au Turkménistan. Première image : la route circulaire, une partie du bâtiment central et certaines routes de services sont présentes. Deuxième image : tous les objets sont redessinées, le bâtiment centrale prend son emprise réelle, les barrières, les deux terrain de sport au sud, tous les arbres et zone d'herbe apparaissent !

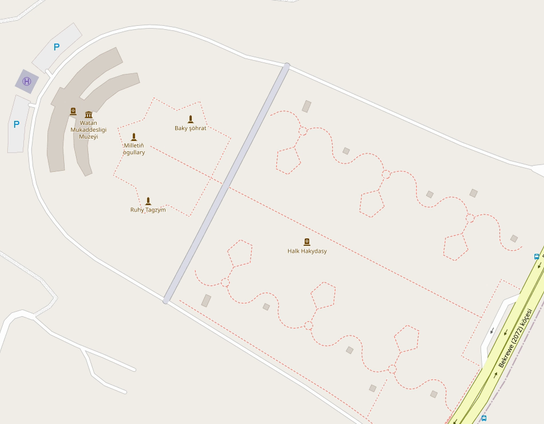
Carto du parc du Musée de la Terre sacrée (Watan Mukaddesligi Muzeýi, Sacred Homeland Museum) à Achgabat !

openstreetmap.org/#map=17/37.9

GIF animé d'une carte OpenStreetMap.

Première image : le bâtiment est présent et la route faisant le tour du lieu est grossièrement tracé, il y a des chemins piétons.

Deuxième image : les bâtiments, les zones de bois, d'herbe, d'eau, les chemins piétons, de nombreux arbres individuellement apparaissent, le bâtiment est redessinées et les routes sont toutes affinées !
ALT text

GIF animé d'une carte OpenStreetMap. Première image : le bâtiment est présent et la route faisant le tour du lieu est grossièrement tracé, il y a des chemins piétons. Deuxième image : les bâtiments, les zones de bois, d'herbe, d'eau, les chemins piétons, de nombreux arbres individuellement apparaissent, le bâtiment est redessinées et les routes sont toutes affinées !

Petit tour cartographique le long de la route commerciale au nord d'Achgabat.

En vrai, j'ai fait ça sur 4 km mais je vous montre 1 km (Mastodon n'accepte pas mes plus gros gif 😅)

openstreetmap.org/#map=16/37.9

GIF animé d'une carte OpenStreetMap de Achgabat, au Turkménistan, le long de la route passant devant de nombreux commerce au nord de la ville.

Première image : la route centrale et les routes secondaires sont présentes avec le nom des rues, ainsi que les bâtiments avec le nom des magasins.

Deuxième image : les bâtiments et routes sont redessinés, les zones de parking, les zone d'herbe, les arbres (et zone d'arbre au nord avec quelque lignes électriques), les barrières et portails, ainsi que les chemins piétons apparaissent !
ALT text

GIF animé d'une carte OpenStreetMap de Achgabat, au Turkménistan, le long de la route passant devant de nombreux commerce au nord de la ville. Première image : la route centrale et les routes secondaires sont présentes avec le nom des rues, ainsi que les bâtiments avec le nom des magasins. Deuxième image : les bâtiments et routes sont redessinés, les zones de parking, les zone d'herbe, les arbres (et zone d'arbre au nord avec quelque lignes électriques), les barrières et portails, ainsi que les chemins piétons apparaissent !

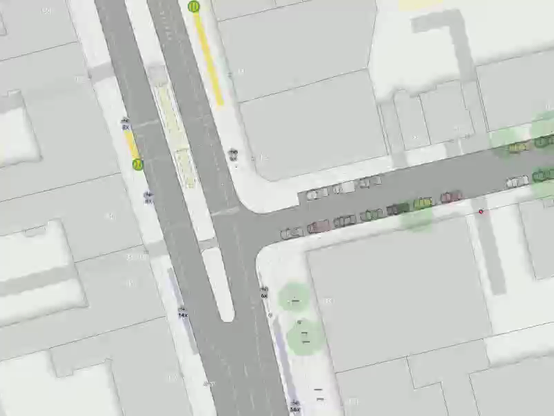
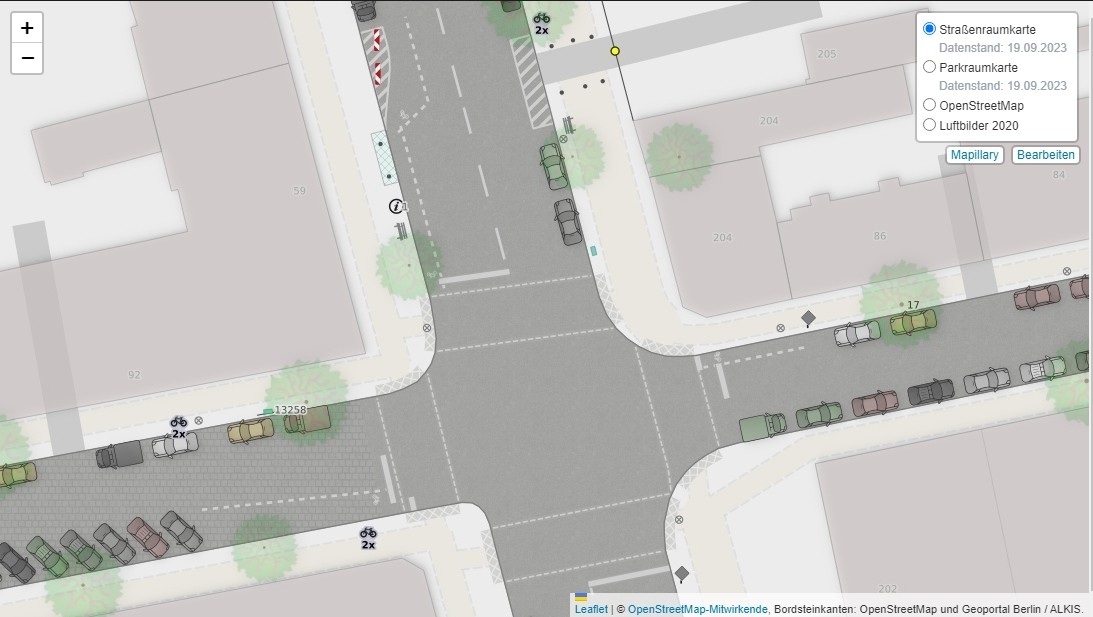
Ce style cartographique (basé sur les données ) qui se concentre sur le paysage urbain est magnifique 🤩

🖥 Le code source : github.com/SupaplexOSM/strasse

🗺 Un superbe exemple en ligne : strassenraumkarte.osm-berlin.o

Thanks @Supaplex030 🙏

vue du ciel d'un carrefour avec beaucoup de détails
ALT text

vue du ciel d'un carrefour avec beaucoup de détails

vue du ciel d'un carrefour avec beaucoup de détails
ALT text

vue du ciel d'un carrefour avec beaucoup de détails

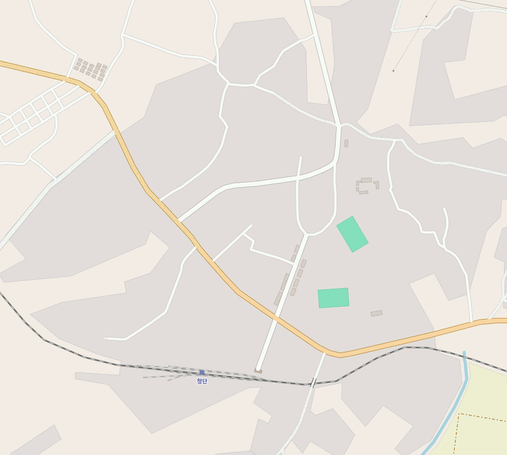
GIF animé d'une carte OpenStreetMap. Village de Cheongjeong-ri, dans l'arrondissement de Chongdan, en Corée du Nord.

Première image : la route qui passe devant le village et quelques routes résidentielles sont cartographiés, avec une timide zone agricole au sud ouest, et rien d'autre.

Deuxième image : tous les bâtiments, tous les routes (chemin, routes résidentielles), des POI, une école, toutes les zones sont décrites (zones agricoles, la forêt, les vergés, les broussailles, etc...), les cours d'eau, le lac, la zone industrielle, bref tout, apparaissent !
ALT text

GIF animé d'une carte OpenStreetMap. Village de Cheongjeong-ri, dans l'arrondissement de Chongdan, en Corée du Nord. Première image : la route qui passe devant le village et quelques routes résidentielles sont cartographiés, avec une timide zone agricole au sud ouest, et rien d'autre. Deuxième image : tous les bâtiments, tous les routes (chemin, routes résidentielles), des POI, une école, toutes les zones sont décrites (zones agricoles, la forêt, les vergés, les broussailles, etc...), les cours d'eau, le lac, la zone industrielle, bref tout, apparaissent !

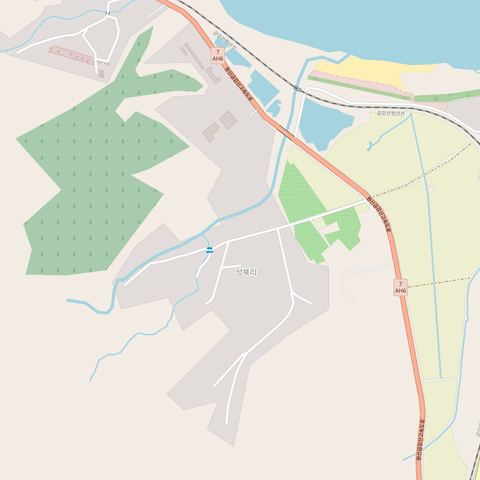
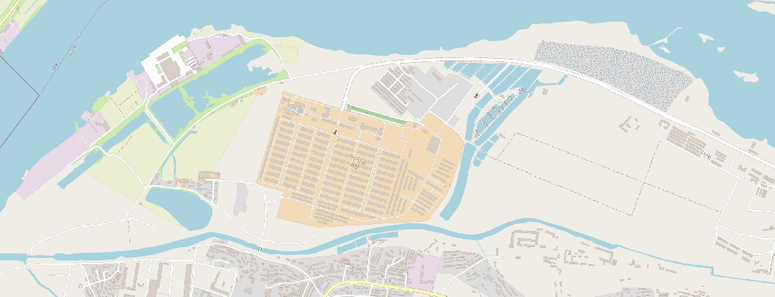
GIF animé d'une carte OpenStreetMap, le village de Songbuk-ri au sud de la baie de Corée, dans le Kangwon, au sud-est de la Corée du Nord, à quelques kilomètres de la frontière avec la Corée du Sud.

Première image : la principale route est présente au nord, avec quelques routes résidentielles et la ligne de chemin de fer plus au nord. La zone résidentielle est grossièrement faite. Il n'y a presque aucun bâtiment, et on remarque une petite zone de cimetière à l'ouest et de champs à l'est.

Deuxième image : tous les objets sont intégralement redessinés sauf le trait de côte au nord, soit : tous les bâtiments, toutes les routes, tous les cours d'eau. De nombreux bâtiments et zones de forêt apparaissent.
ALT text

GIF animé d'une carte OpenStreetMap, le village de Songbuk-ri au sud de la baie de Corée, dans le Kangwon, au sud-est de la Corée du Nord, à quelques kilomètres de la frontière avec la Corée du Sud. Première image : la principale route est présente au nord, avec quelques routes résidentielles et la ligne de chemin de fer plus au nord. La zone résidentielle est grossièrement faite. Il n'y a presque aucun bâtiment, et on remarque une petite zone de cimetière à l'ouest et de champs à l'est. Deuxième image : tous les objets sont intégralement redessinés sauf le trait de côte au nord, soit : tous les bâtiments, toutes les routes, tous les cours d'eau. De nombreux bâtiments et zones de forêt apparaissent.

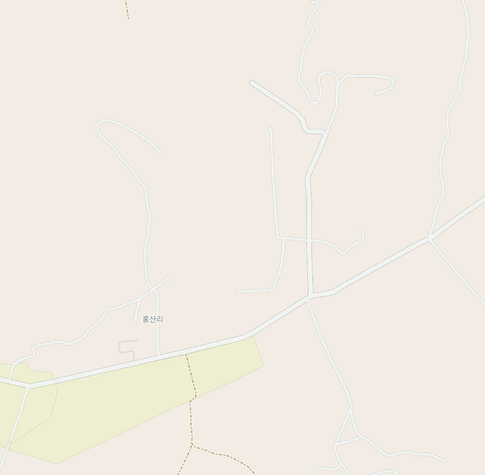
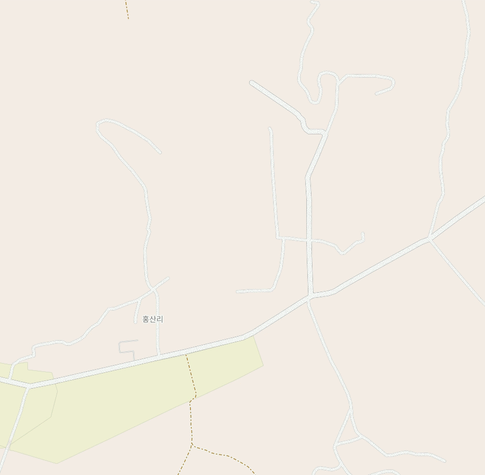
Cartographie dont je suis assez content. Le avant après est assez saisissant 😁. C'est dans la campagne nord-coréenne, dans le sud du pays dans l'arrondissement de Chongdan, dans et autour du village de Hongsan-ri.

openstreetmap.org/#map=15/37.9

GIF animé d'une carte OpenStreetMap. GIF avant après, dans et autour du village de Hongsan-ri, arrondissement de Chongdan, Corée du Nord

Première image : les principales routes sont présentes, avec une légère zone agricole au sud-ouest.

Deuxième image : tous les bâtiments, le POI, l'école, toutes les routes, mais surtout les landuses : toutes les zones agricoles, de bois, de verger, de mine, le lac et la zone industrielle apparaissent !
ALT text

GIF animé d'une carte OpenStreetMap. GIF avant après, dans et autour du village de Hongsan-ri, arrondissement de Chongdan, Corée du Nord Première image : les principales routes sont présentes, avec une légère zone agricole au sud-ouest. Deuxième image : tous les bâtiments, le POI, l'école, toutes les routes, mais surtout les landuses : toutes les zones agricoles, de bois, de verger, de mine, le lac et la zone industrielle apparaissent !

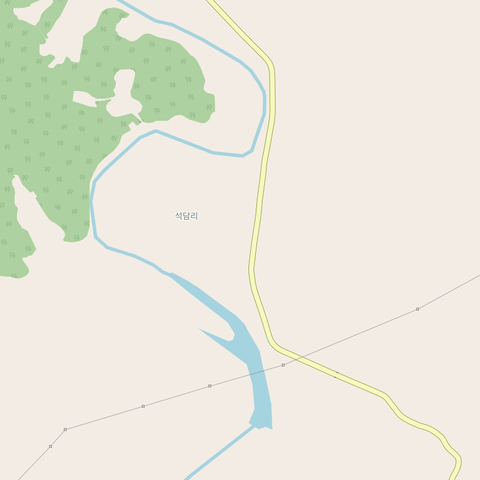
Ajout du village de Sokdam dans la campagne nord-coréenne.

openstreetmap.org/#map=16/38.1

GIF animé d'une carte OpenStreetMap. Village de Sokdam dans l'arrondissement de Pyoksong, au sud du Hwanghae du Sud, en Corée du Nord.

Première image : La principale route allant du nord au sud, la ligne électrique allant d'ouest en est, et un bout de forêt à l'ouest sont présents.

Deuxième image : tous les bâtiments et routes, l'école, les zones résidentielles, agricoles et boisées, la ferme et les petits cours d'eau apparaissent !
ALT text

GIF animé d'une carte OpenStreetMap. Village de Sokdam dans l'arrondissement de Pyoksong, au sud du Hwanghae du Sud, en Corée du Nord. Première image : La principale route allant du nord au sud, la ligne électrique allant d'ouest en est, et un bout de forêt à l'ouest sont présents. Deuxième image : tous les bâtiments et routes, l'école, les zones résidentielles, agricoles et boisées, la ferme et les petits cours d'eau apparaissent !

Ma cartographie des 7 derniers jours.

Et la dernière image c'est la vue d'ensemble de la zone amélioré. Avez-vous trouvé où le deuxième GIF se trouve ? 😜

openstreetmap.org/#map=14/41.6

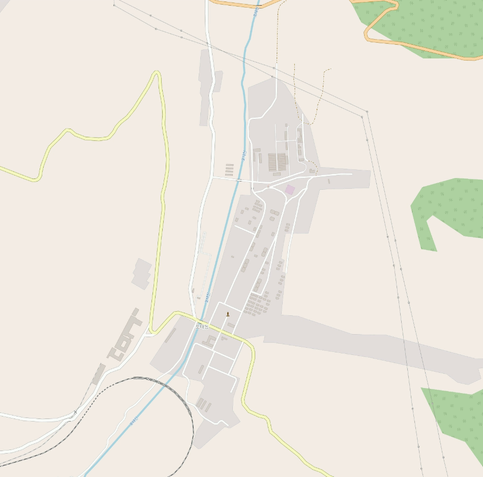
GIF animé d'une carte OpenStreetMap de la ville de Potae-rodongjagu (ou Phothae-dong), au sud du Mont Paektu en Corée du Nord.

Première image : Une zone résidentielle entoure plusieurs bâtiments, le cours d'eau qui traverse la ville du nord au sud est présent, avec les principales routes et la ligne haute tension qui contourne la ville par le l'est et le nord.

Deuxième image : tous les bâtiments, la zone industrielle à l'ouest, les zones de bois, de champs, de broussailles apparaissent tout autour de la ville, toute la zone résidentielle et les routes sont redessinés !
ALT text

GIF animé d'une carte OpenStreetMap de la ville de Potae-rodongjagu (ou Phothae-dong), au sud du Mont Paektu en Corée du Nord. Première image : Une zone résidentielle entoure plusieurs bâtiments, le cours d'eau qui traverse la ville du nord au sud est présent, avec les principales routes et la ligne haute tension qui contourne la ville par le l'est et le nord. Deuxième image : tous les bâtiments, la zone industrielle à l'ouest, les zones de bois, de champs, de broussailles apparaissent tout autour de la ville, toute la zone résidentielle et les routes sont redessinés !

GIF animé d'une carte OpenStreetMap d'un village récemment construit, au sud du Mont Paektu, au sud de l'arrondissement de Samjiyon.

Première image : Il y a uniquement une route qui longe le village au sud.

Deuxième image : tous les bâtiments, un monument entouré de deux bâtiments avec une zone piétonne devant et d'une zone d'arbres derrière, une école avec son terrain de sport, les routes, les zones agricoles au nord, de broussailles au sud et de prairies tout autour, apparaissent !
ALT text

GIF animé d'une carte OpenStreetMap d'un village récemment construit, au sud du Mont Paektu, au sud de l'arrondissement de Samjiyon. Première image : Il y a uniquement une route qui longe le village au sud. Deuxième image : tous les bâtiments, un monument entouré de deux bâtiments avec une zone piétonne devant et d'une zone d'arbres derrière, une école avec son terrain de sport, les routes, les zones agricoles au nord, de broussailles au sud et de prairies tout autour, apparaissent !

GIF animé d'une carte OpenStreetMap d'un village récemment construit, au sud du Mont Paektu, au sud de l'arrondissement de Samjiyon.

Première image : Il y a une route qui longe le village au nord. Dans le village il y a des routes résidentielles, et la zone résidentielle est présente avec des bâtiments ordonnés de manière rectangulaire.

Deuxième image : La zone a été démolie puis reconstruite. Les bâtiments suivent maintenant un plan en quart de cercle. Toutes les routes résidentielles suivent ce plan. De chaque côte de la route au nord du village, une bande de forêt apparait, et derrière ces zones de forêt il y a des zones de champs. Des champs au sud, à l'est, et un peu à l'ouest entourent le village.
ALT text

GIF animé d'une carte OpenStreetMap d'un village récemment construit, au sud du Mont Paektu, au sud de l'arrondissement de Samjiyon. Première image : Il y a une route qui longe le village au nord. Dans le village il y a des routes résidentielles, et la zone résidentielle est présente avec des bâtiments ordonnés de manière rectangulaire. Deuxième image : La zone a été démolie puis reconstruite. Les bâtiments suivent maintenant un plan en quart de cercle. Toutes les routes résidentielles suivent ce plan. De chaque côte de la route au nord du village, une bande de forêt apparait, et derrière ces zones de forêt il y a des zones de champs. Des champs au sud, à l'est, et un peu à l'ouest entourent le village.

Image d'une Carte OpenStreetMap avec du recul. Carte centré sur la ville de Potae-rodongjagu. Vue d'ensemble de la zone travaillé pendant 7 jours. La carte fourmille de détail au centre, avec de nombreux détails de landuse, et elle est peu détaillé tout autour de cette zone.
ALT text

Image d'une Carte OpenStreetMap avec du recul. Carte centré sur la ville de Potae-rodongjagu. Vue d'ensemble de la zone travaillé pendant 7 jours. La carte fourmille de détail au centre, avec de nombreux détails de landuse, et elle est peu détaillé tout autour de cette zone.

Cartographie de l'ilot Tudan-do à Pyongyang

Est-ce qu'on doit appeler ça une ile, un ilot ou c'est aucun des deux ? (une presqu'ile ?)

openstreetmap.org/#map=15/38.9

GIF animé d'une carte OpenStreetMap, ilot (ou ile) de Tudan-do, au sud-ouest de Pyongyang.

Première image : De nombreux bâtiments, et la principale route d'accès est cartographié avec la plupart des zones d'eaux.

Deuxième image : les bâtiments manquants sont rajoutés, tous les chemins, toutes les zones d'eau sont complétés, les zones agricoles sont rajoutées !
ALT text

GIF animé d'une carte OpenStreetMap, ilot (ou ile) de Tudan-do, au sud-ouest de Pyongyang. Première image : De nombreux bâtiments, et la principale route d'accès est cartographié avec la plupart des zones d'eaux. Deuxième image : les bâtiments manquants sont rajoutés, tous les chemins, toutes les zones d'eau sont complétés, les zones agricoles sont rajoutées !

Pour ce gif je suis assez fière du travail réalisé, c'est la ville de Chongdan-up à l'ouest d'une large zone que j'ai pas mal cartographié !

openstreetmap.org/#map=16/37.9

GIF animé d'une carte OpenStreetMap, ville de Chongdan-up dans le Hwanghae du Sud, en Corée du Nord.

Première image : la principale route traversant la vile du nord-ouest au sud-est est présentes, les autres principaux axes routiers dans la ville sont cartographié avec une zone résidentielle.

Deuxième image : tous les bâtiments, toutes les écoles, le marché public, le stade, les routes résidentielles, les cours d'eau, et le landuse environnant (des champs) apparaissent, toutes les formes sont redessinés plus précisement !
ALT text

GIF animé d'une carte OpenStreetMap, ville de Chongdan-up dans le Hwanghae du Sud, en Corée du Nord. Première image : la principale route traversant la vile du nord-ouest au sud-est est présentes, les autres principaux axes routiers dans la ville sont cartographié avec une zone résidentielle. Deuxième image : tous les bâtiments, toutes les écoles, le marché public, le stade, les routes résidentielles, les cours d'eau, et le landuse environnant (des champs) apparaissent, toutes les formes sont redessinés plus précisement !

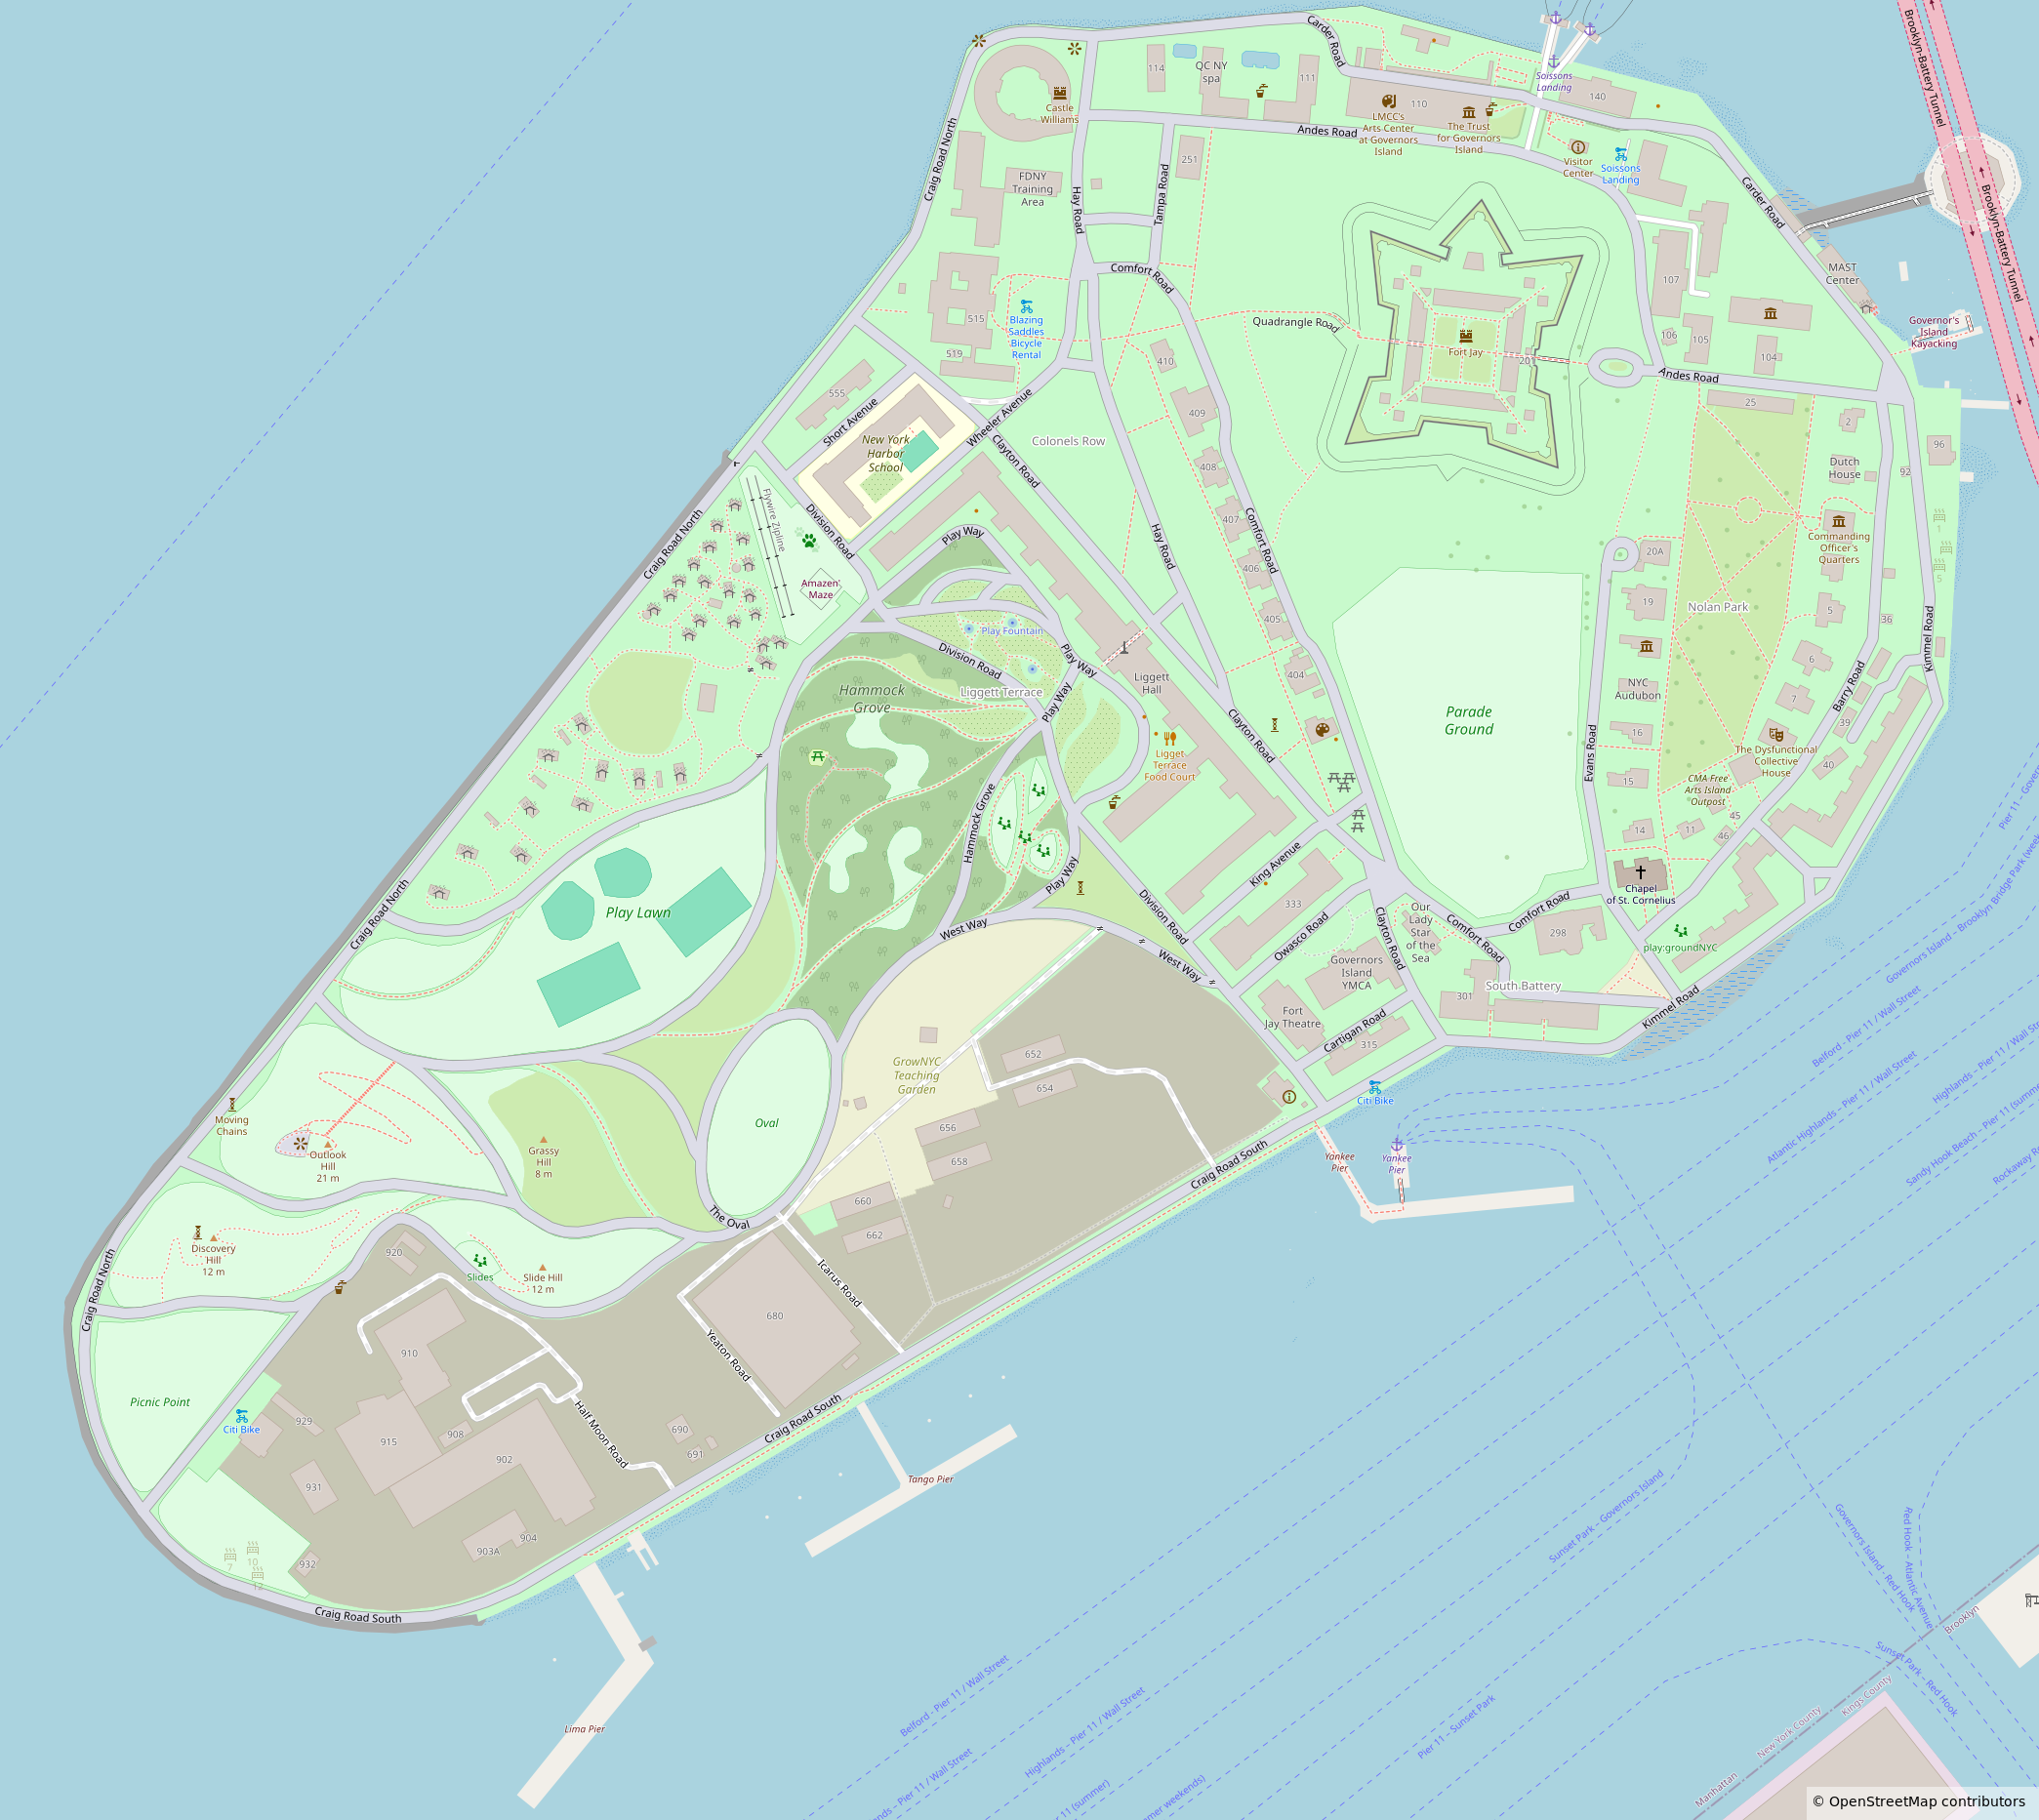
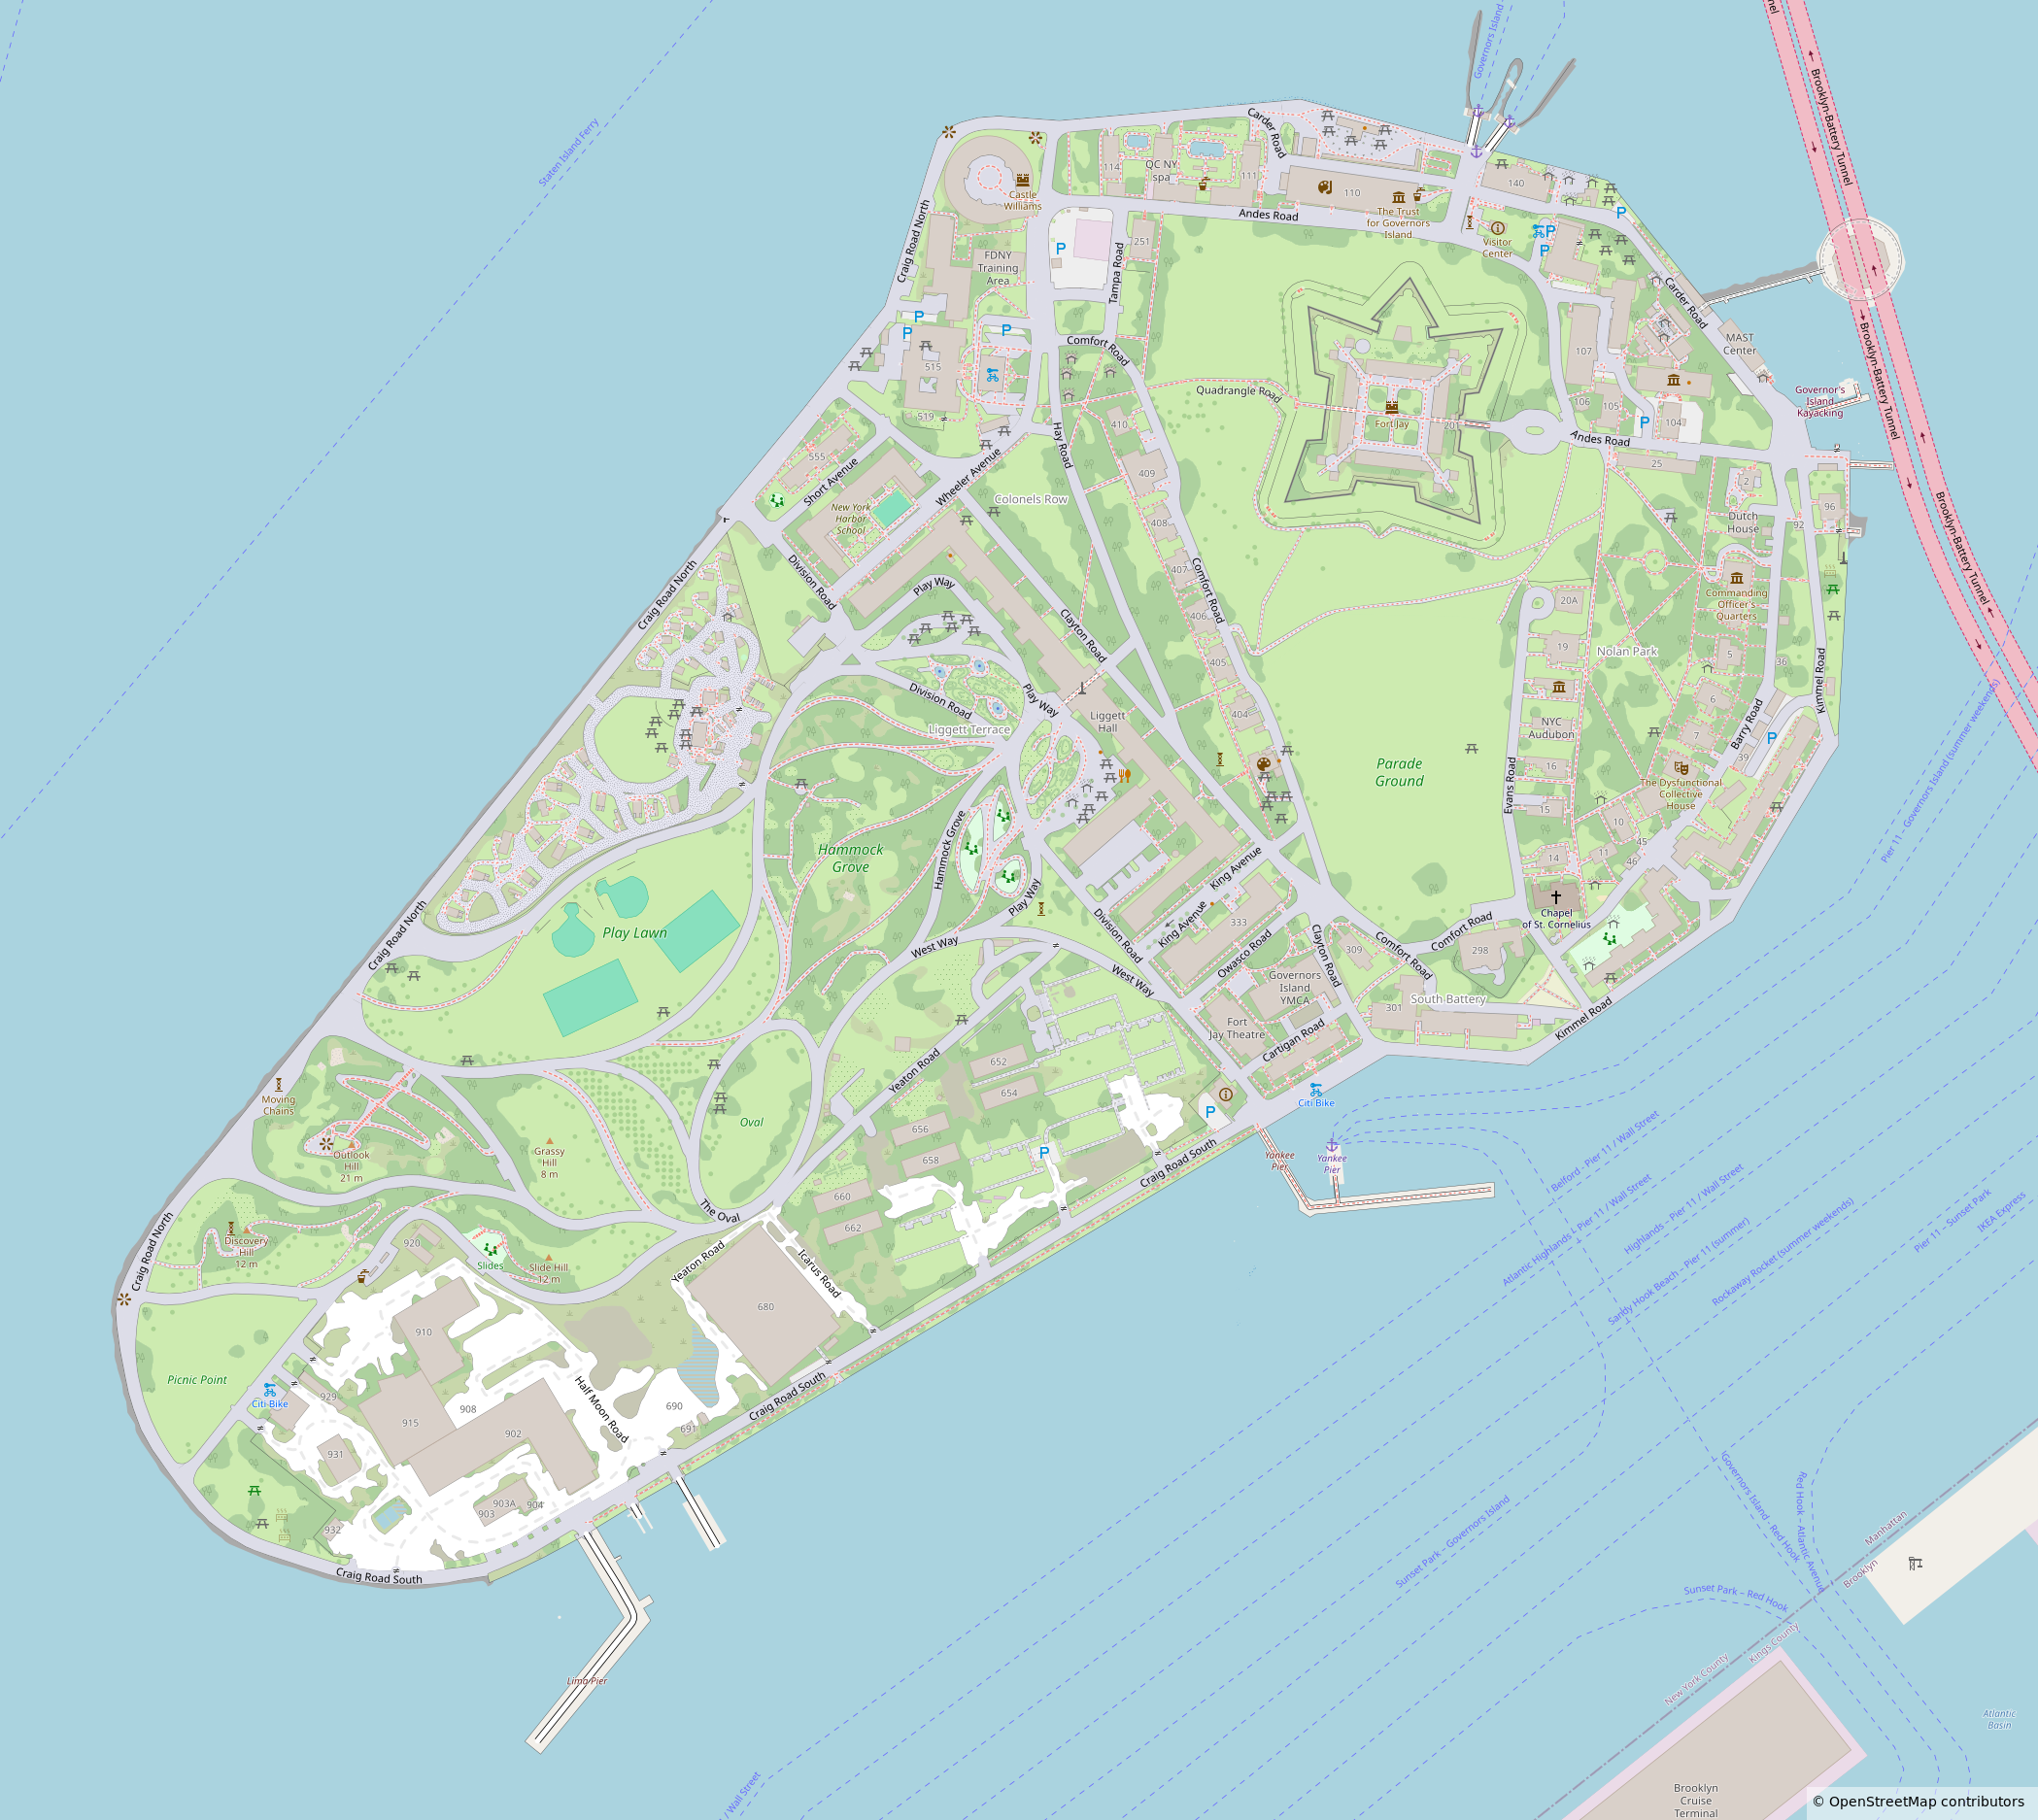
Finished micromapping Governors Island in New York a few days ago!

For anyone curious, I used a combination of Bing and NYS Orthos Online aerial imagery. The footpaths in the older areas came from a 1960’s US Department of Engineers tree survey map that had the island drawn in great detail. The rest of the information came from wikipedia articles and wikimedia + other license compatiable images. This resulted in 37,376 changes and a lot of hours of work

openstreetmap.org/#map=17/40.6

Petit carto à côté d'un lac et autour d'un monument.

openstreetmap.org/#map=18/38.0

GIF animé d'une carte OpenStreetMap. Zone sud du lac Kuam-ho, dans l'arrondissement de Chongdan, en Corée du Nord.

Première image : Une zone d'eau au nord, et une route au sud, rien de plus.

Deuxième image : Le barrage à l'ouest est représenté, tout le trait de côté du lac est redessiné, la zone résidentielle, les bâtiments, les routes apparaissent ! Le monument avec devant, des zones d'herbes et, derrière, la zone de bois apparaissent au sud du lac, avec la route d'accès.
ALT text

GIF animé d'une carte OpenStreetMap. Zone sud du lac Kuam-ho, dans l'arrondissement de Chongdan, en Corée du Nord. Première image : Une zone d'eau au nord, et une route au sud, rien de plus. Deuxième image : Le barrage à l'ouest est représenté, tout le trait de côté du lac est redessiné, la zone résidentielle, les bâtiments, les routes apparaissent ! Le monument avec devant, des zones d'herbes et, derrière, la zone de bois apparaissent au sud du lac, avec la route d'accès.

Je cartographie la capital du Turkménistan, Ashgabat, depuis un bon moment mais je n'ai pas encore montré ici les avant/après, voilà donc le premier de la série !

openstreetmap.org/#map=17/37.8

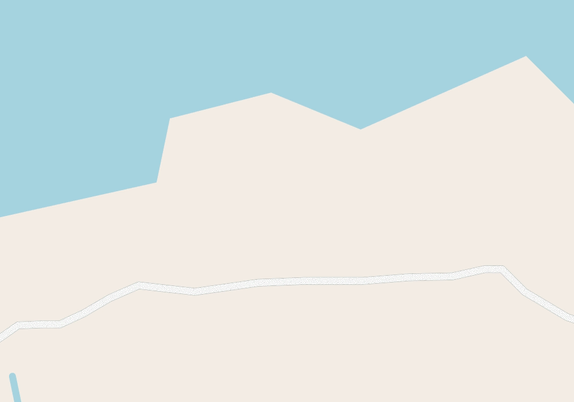
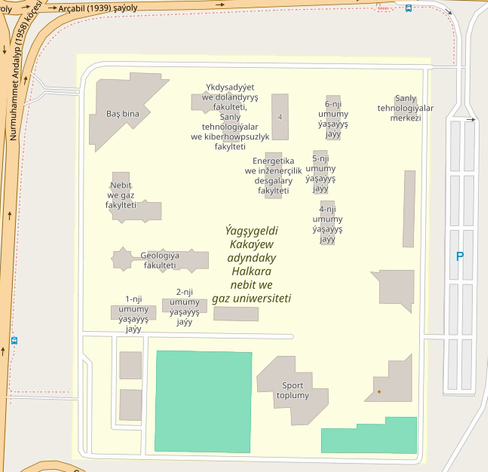
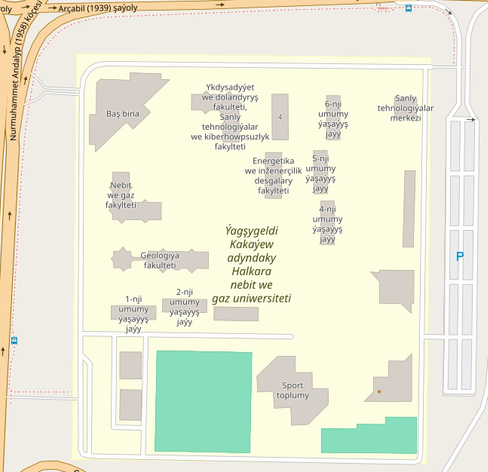
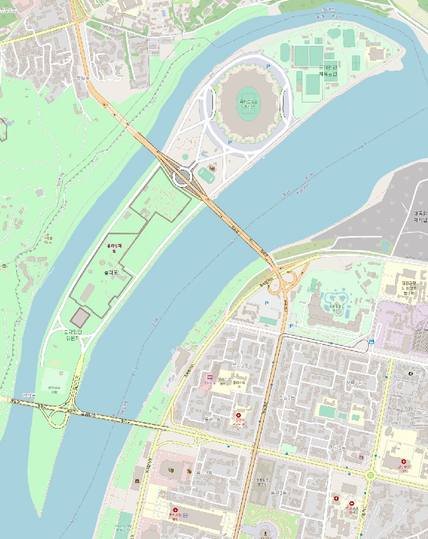
GIF animé d'une carte OpenStreetMap. Université Internationale du Pétrole et du Gaz à Ashgabat, au Turkménistan.

Première image : les bâtiments sont présents, il y a quelques routes mais aucune dans l'enceinte de l'école.

Deuxième image : les bâtiments sont redessinées, toutes les routes sont présentes, les terrains de sport sont bien distinguable, les zones d'herbes apparaissent avec les arbres, une œuvre d'art fait sont apparition au sud-est, et la barrière de l'enceinte de l'école est présente.
ALT text

GIF animé d'une carte OpenStreetMap. Université Internationale du Pétrole et du Gaz à Ashgabat, au Turkménistan. Première image : les bâtiments sont présents, il y a quelques routes mais aucune dans l'enceinte de l'école. Deuxième image : les bâtiments sont redessinées, toutes les routes sont présentes, les terrains de sport sont bien distinguable, les zones d'herbes apparaissent avec les arbres, une œuvre d'art fait sont apparition au sud-est, et la barrière de l'enceinte de l'école est présente.

GIF animé d'une carte OpenStreetMap. Université Internationale du Pétrole et du Gaz à Ashgabat, au Turkménistan.

Première image : les bâtiments sont présents, il y a quelques routes mais aucune dans l'enceinte de l'école.

Deuxième image : les bâtiments sont redessinées, toutes les routes sont présentes, les terrains de sport sont bien distinguable, les zones d'herbes apparaissent avec les arbres, une œuvre d'art fait sont apparition au sud-est, et la barrière de l'enceinte de l'école est présente.
ALT text

GIF animé d'une carte OpenStreetMap. Université Internationale du Pétrole et du Gaz à Ashgabat, au Turkménistan. Première image : les bâtiments sont présents, il y a quelques routes mais aucune dans l'enceinte de l'école. Deuxième image : les bâtiments sont redessinées, toutes les routes sont présentes, les terrains de sport sont bien distinguable, les zones d'herbes apparaissent avec les arbres, une œuvre d'art fait sont apparition au sud-est, et la barrière de l'enceinte de l'école est présente.

GIF animé d'une carte OpenStreetMap de l'hôtel Yydlyz, à Achgabat au Turkménistan.

Première image : la route circulaire, une partie du bâtiment central et certaines routes de services sont présentes.

Deuxième image : tous les objets sont redessinées, le bâtiment centrale prend son emprise réelle, les barrières, les deux terrain de sport au sud, tous les arbres et zone d'herbe apparaissent !
ALT text

GIF animé d'une carte OpenStreetMap de l'hôtel Yydlyz, à Achgabat au Turkménistan. Première image : la route circulaire, une partie du bâtiment central et certaines routes de services sont présentes. Deuxième image : tous les objets sont redessinées, le bâtiment centrale prend son emprise réelle, les barrières, les deux terrain de sport au sud, tous les arbres et zone d'herbe apparaissent !

Carto du parc du Musée de la Terre sacrée (Watan Mukaddesligi Muzeýi, Sacred Homeland Museum) à Achgabat !

openstreetmap.org/#map=17/37.9

GIF animé d'une carte OpenStreetMap.

Première image : le bâtiment est présent et la route faisant le tour du lieu est grossièrement tracé, il y a des chemins piétons.

Deuxième image : les bâtiments, les zones de bois, d'herbe, d'eau, les chemins piétons, de nombreux arbres individuellement apparaissent, le bâtiment est redessinées et les routes sont toutes affinées !
ALT text

GIF animé d'une carte OpenStreetMap. Première image : le bâtiment est présent et la route faisant le tour du lieu est grossièrement tracé, il y a des chemins piétons. Deuxième image : les bâtiments, les zones de bois, d'herbe, d'eau, les chemins piétons, de nombreux arbres individuellement apparaissent, le bâtiment est redessinées et les routes sont toutes affinées !

Cartographie de l'ilot Tudan-do à Pyongyang

Est-ce qu'on doit appeler ça une ile, un ilot ou c'est aucun des deux ? (une presqu'ile ?)

openstreetmap.org/#map=15/38.9

GIF animé d'une carte OpenStreetMap, ilot (ou ile) de Tudan-do, au sud-ouest de Pyongyang.

Première image : De nombreux bâtiments, et la principale route d'accès est cartographié avec la plupart des zones d'eaux.

Deuxième image : les bâtiments manquants sont rajoutés, tous les chemins, toutes les zones d'eau sont complétés, les zones agricoles sont rajoutées !
ALT text

GIF animé d'une carte OpenStreetMap, ilot (ou ile) de Tudan-do, au sud-ouest de Pyongyang. Première image : De nombreux bâtiments, et la principale route d'accès est cartographié avec la plupart des zones d'eaux. Deuxième image : les bâtiments manquants sont rajoutés, tous les chemins, toutes les zones d'eau sont complétés, les zones agricoles sont rajoutées !

Pour ce gif je suis assez fière du travail réalisé, c'est la ville de Chongdan-up à l'ouest d'une large zone que j'ai pas mal cartographié !

openstreetmap.org/#map=16/37.9

GIF animé d'une carte OpenStreetMap, ville de Chongdan-up dans le Hwanghae du Sud, en Corée du Nord.

Première image : la principale route traversant la vile du nord-ouest au sud-est est présentes, les autres principaux axes routiers dans la ville sont cartographié avec une zone résidentielle.

Deuxième image : tous les bâtiments, toutes les écoles, le marché public, le stade, les routes résidentielles, les cours d'eau, et le landuse environnant (des champs) apparaissent, toutes les formes sont redessinés plus précisement !
ALT text

GIF animé d'une carte OpenStreetMap, ville de Chongdan-up dans le Hwanghae du Sud, en Corée du Nord. Première image : la principale route traversant la vile du nord-ouest au sud-est est présentes, les autres principaux axes routiers dans la ville sont cartographié avec une zone résidentielle. Deuxième image : tous les bâtiments, toutes les écoles, le marché public, le stade, les routes résidentielles, les cours d'eau, et le landuse environnant (des champs) apparaissent, toutes les formes sont redessinés plus précisement !

Carto du parc du Musée de la Terre sacrée (Watan Mukaddesligi Muzeýi, Sacred Homeland Museum) à Achgabat !

openstreetmap.org/#map=17/37.9

GIF animé d'une carte OpenStreetMap.

Première image : le bâtiment est présent et la route faisant le tour du lieu est grossièrement tracé, il y a des chemins piétons.

Deuxième image : les bâtiments, les zones de bois, d'herbe, d'eau, les chemins piétons, de nombreux arbres individuellement apparaissent, le bâtiment est redessinées et les routes sont toutes affinées !
ALT text

GIF animé d'une carte OpenStreetMap. Première image : le bâtiment est présent et la route faisant le tour du lieu est grossièrement tracé, il y a des chemins piétons. Deuxième image : les bâtiments, les zones de bois, d'herbe, d'eau, les chemins piétons, de nombreux arbres individuellement apparaissent, le bâtiment est redessinées et les routes sont toutes affinées !

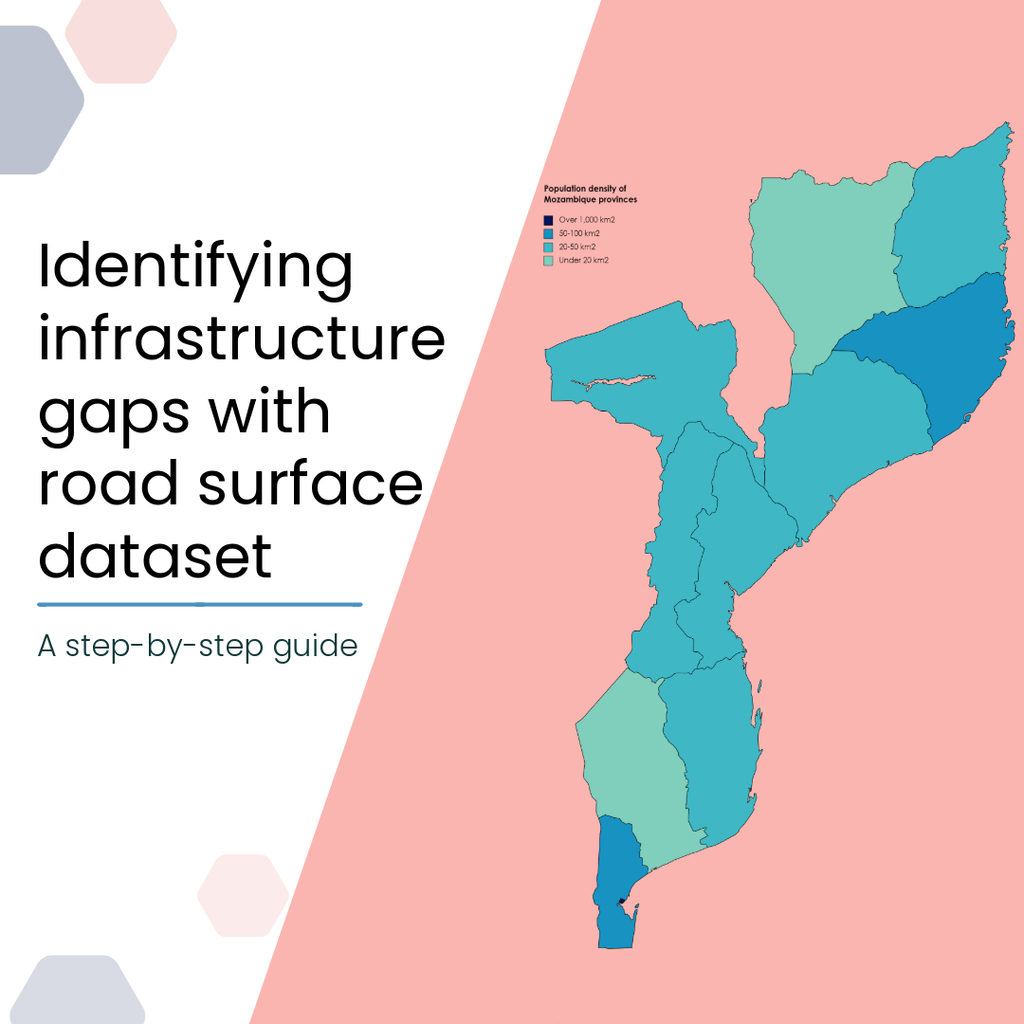
🌍𝐇𝐨𝐰 𝐜𝐚𝐧 𝐫𝐨𝐚𝐝 𝐬𝐮𝐫𝐟𝐚𝐜𝐞 𝐝𝐚𝐭𝐚 𝐡𝐞𝐥𝐩 𝐚𝐧𝐬𝐰𝐞𝐫 𝐛𝐢𝐠 𝐝𝐞𝐯𝐞𝐥𝐨𝐩𝐦𝐞𝐧𝐭 & 𝐡𝐮𝐦𝐚𝐧𝐢𝐭𝐚𝐫𝐢𝐚𝐧 𝐪𝐮𝐞𝐬𝐭𝐢𝐨𝐧𝐬?

📊 The tutorial shows how to combine our global road surface dataset with population data for Mozambique:

overlay road surface + population data
spot infrastructure gaps where many depend on poor/undocumented roads
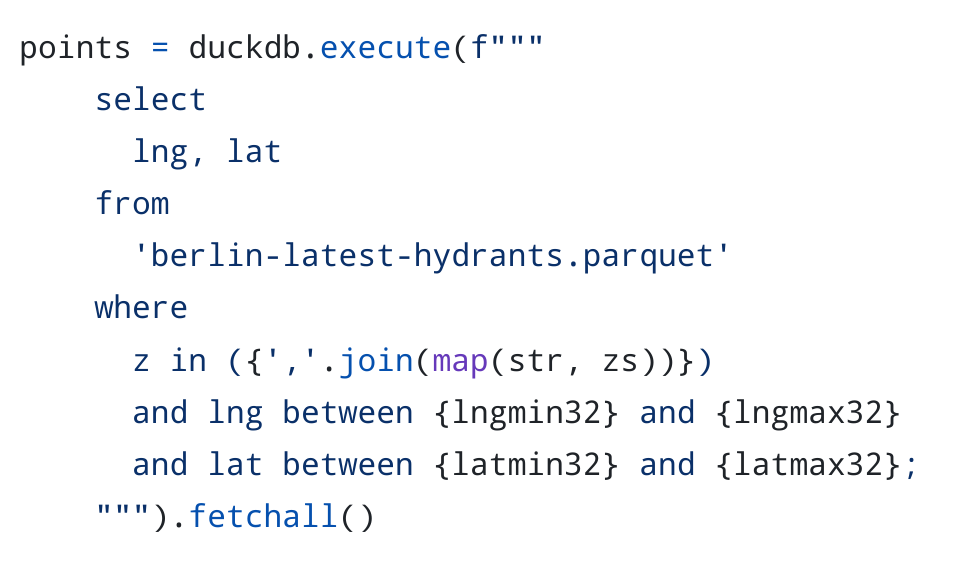
explore data with open tools (DuckDB, Mercantile, Shapely)

👉 heigit.org/identifying-infrast

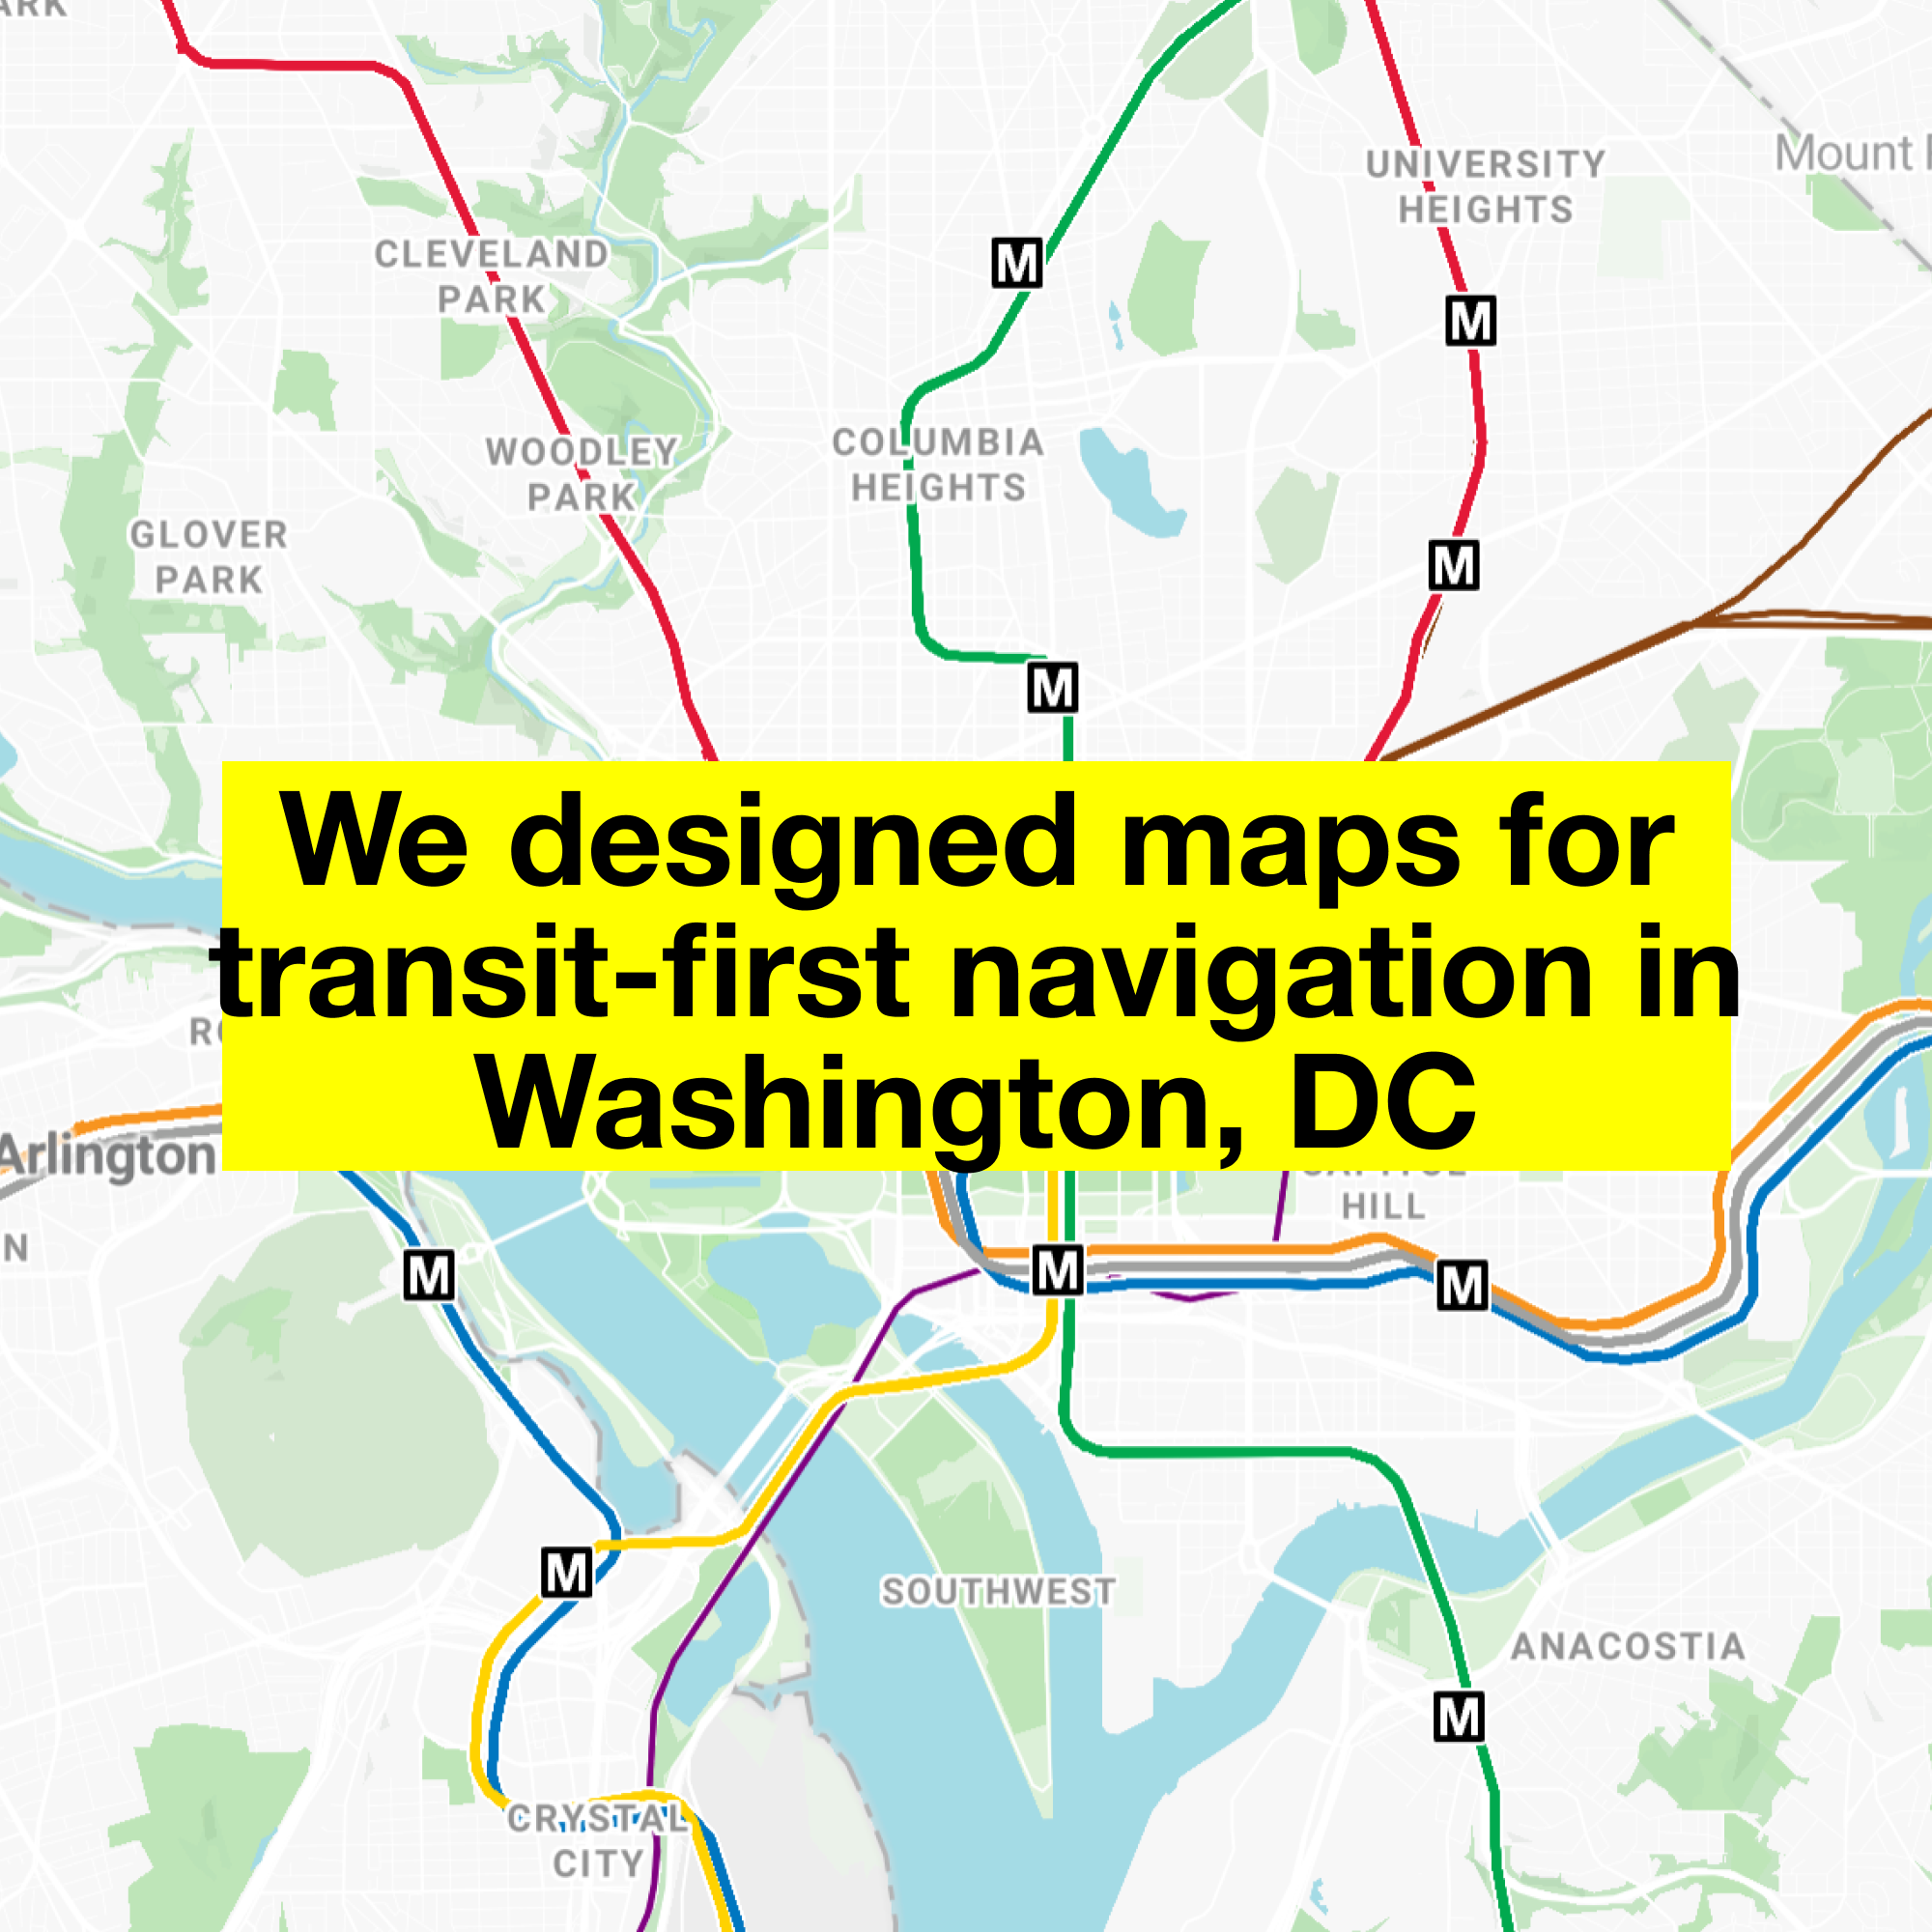
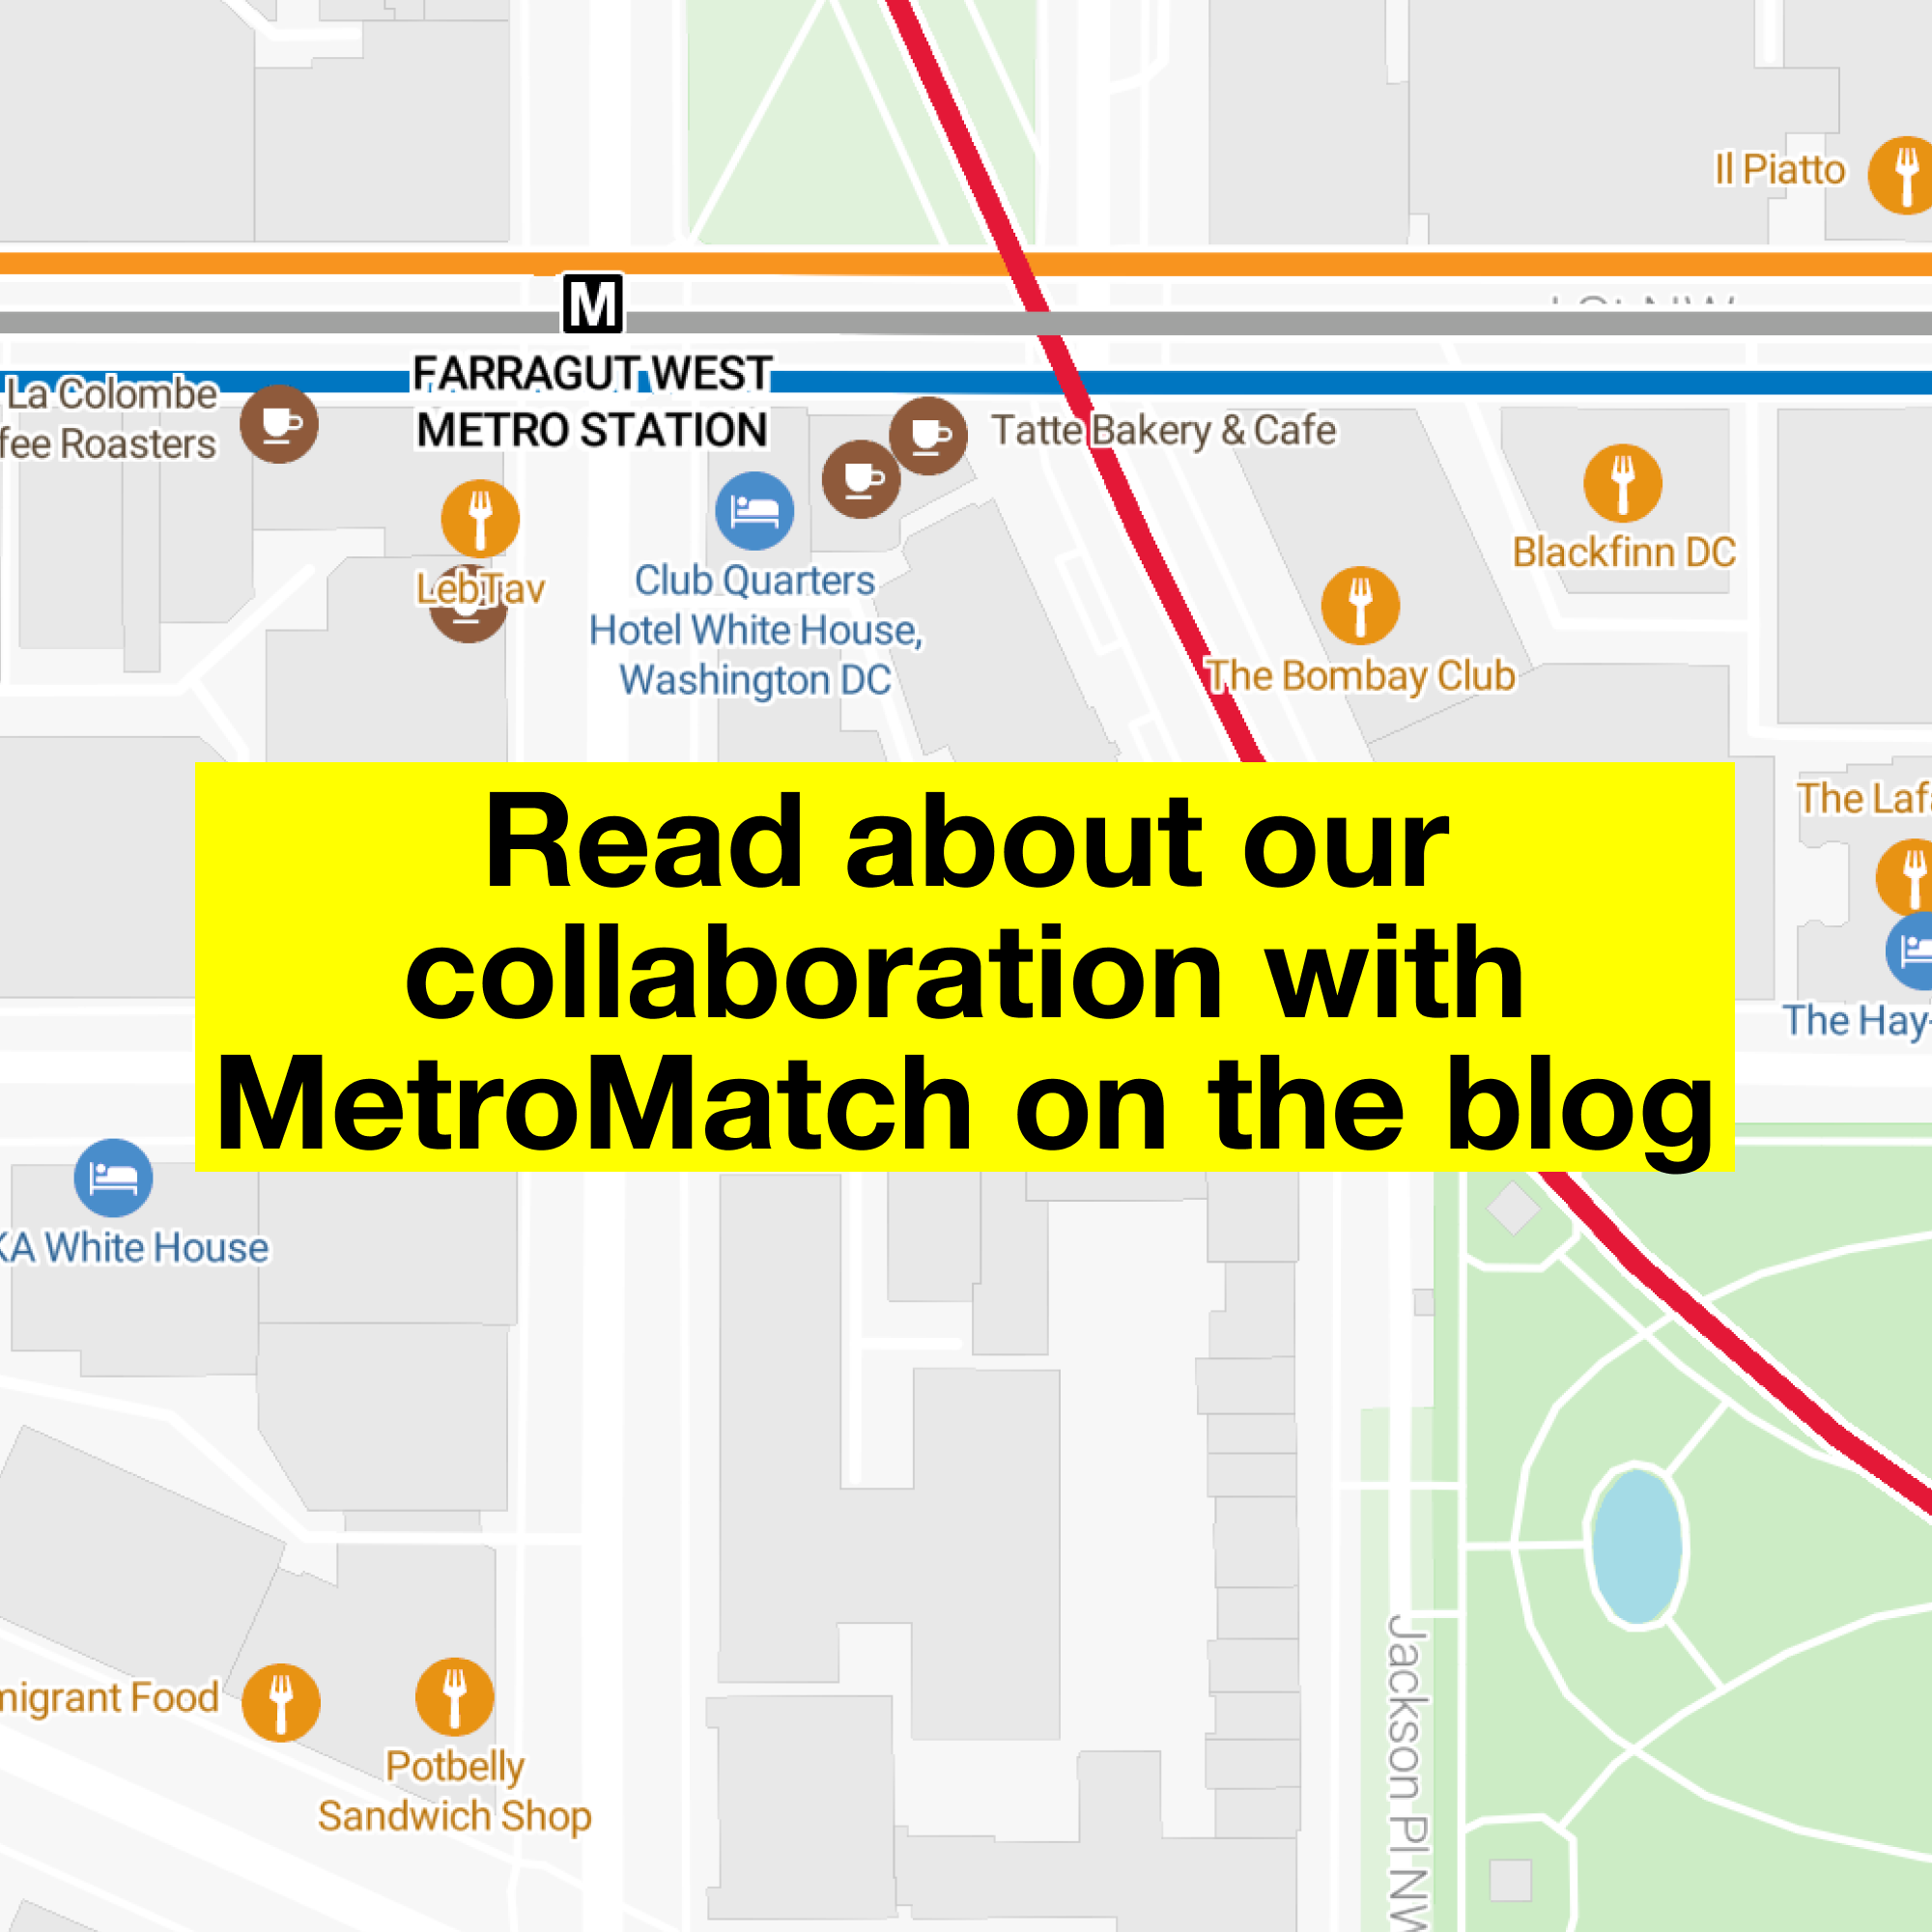
Stamen recently collaborated with MetroMatch, a transit-first navigation tool focused on identifying destinations within walking distance of transit in U.S. cities. Read about how we redesigned their map for Washington, DC on the blog.

stamen.com/navigate-your-city-

A map showing subway lines in DC with the text overlaid: "We designed maps for transit-first navigation in Washington, DC"
ALT text

A map showing subway lines in DC with the text overlaid: "We designed maps for transit-first navigation in Washington, DC"

A zoomed-in map of some subway stations and nearby points-of-interest, with the text overlaid: "Read about our collaboration with MetroMatch on the blog"
ALT text

A zoomed-in map of some subway stations and nearby points-of-interest, with the text overlaid: "Read about our collaboration with MetroMatch on the blog"

Stamen recently collaborated with MetroMatch, a transit-first navigation tool focused on identifying destinations within walking distance of transit in U.S. cities. Read about how we redesigned their map for Washington, DC on the blog.

stamen.com/navigate-your-city-

A map showing subway lines in DC with the text overlaid: "We designed maps for transit-first navigation in Washington, DC"
ALT text

A map showing subway lines in DC with the text overlaid: "We designed maps for transit-first navigation in Washington, DC"

A zoomed-in map of some subway stations and nearby points-of-interest, with the text overlaid: "Read about our collaboration with MetroMatch on the blog"
ALT text

A zoomed-in map of some subway stations and nearby points-of-interest, with the text overlaid: "Read about our collaboration with MetroMatch on the blog"

Stamen recently collaborated with MetroMatch, a transit-first navigation tool focused on identifying destinations within walking distance of transit in U.S. cities. Read about how we redesigned their map for Washington, DC on the blog.

stamen.com/navigate-your-city-

A map showing subway lines in DC with the text overlaid: "We designed maps for transit-first navigation in Washington, DC"
ALT text

A map showing subway lines in DC with the text overlaid: "We designed maps for transit-first navigation in Washington, DC"

A zoomed-in map of some subway stations and nearby points-of-interest, with the text overlaid: "Read about our collaboration with MetroMatch on the blog"
ALT text

A zoomed-in map of some subway stations and nearby points-of-interest, with the text overlaid: "Read about our collaboration with MetroMatch on the blog"

🌍𝐇𝐨𝐰 𝐜𝐚𝐧 𝐫𝐨𝐚𝐝 𝐬𝐮𝐫𝐟𝐚𝐜𝐞 𝐝𝐚𝐭𝐚 𝐡𝐞𝐥𝐩 𝐚𝐧𝐬𝐰𝐞𝐫 𝐛𝐢𝐠 𝐝𝐞𝐯𝐞𝐥𝐨𝐩𝐦𝐞𝐧𝐭 & 𝐡𝐮𝐦𝐚𝐧𝐢𝐭𝐚𝐫𝐢𝐚𝐧 𝐪𝐮𝐞𝐬𝐭𝐢𝐨𝐧𝐬?

📊 The tutorial shows how to combine our global road surface dataset with population data for Mozambique:

overlay road surface + population data
spot infrastructure gaps where many depend on poor/undocumented roads
explore data with open tools (DuckDB, Mercantile, Shapely)

👉 heigit.org/identifying-infrast

GIF animé d'une carte OpenStreetMap de l'hôtel Yydlyz, à Achgabat au Turkménistan.

Première image : la route circulaire, une partie du bâtiment central et certaines routes de services sont présentes.

Deuxième image : tous les objets sont redessinées, le bâtiment centrale prend son emprise réelle, les barrières, les deux terrain de sport au sud, tous les arbres et zone d'herbe apparaissent !
ALT text

GIF animé d'une carte OpenStreetMap de l'hôtel Yydlyz, à Achgabat au Turkménistan. Première image : la route circulaire, une partie du bâtiment central et certaines routes de services sont présentes. Deuxième image : tous les objets sont redessinées, le bâtiment centrale prend son emprise réelle, les barrières, les deux terrain de sport au sud, tous les arbres et zone d'herbe apparaissent !

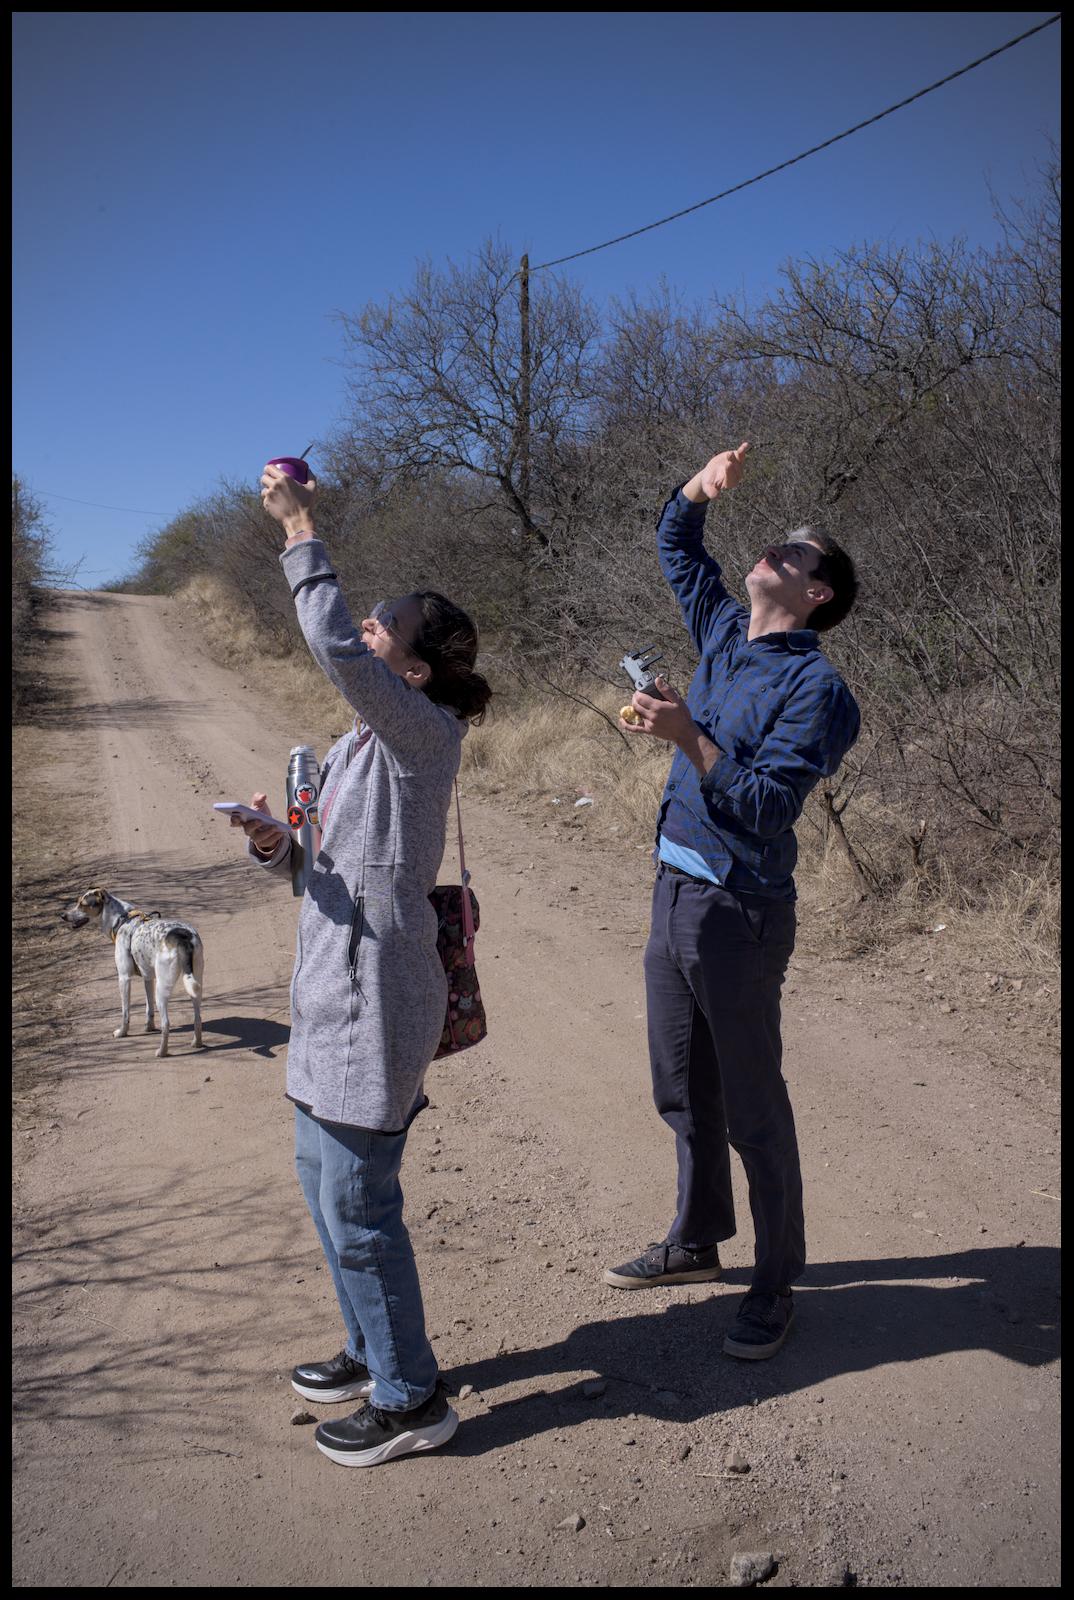
Had a blast at our little birthday celebration. 🍰 🧉

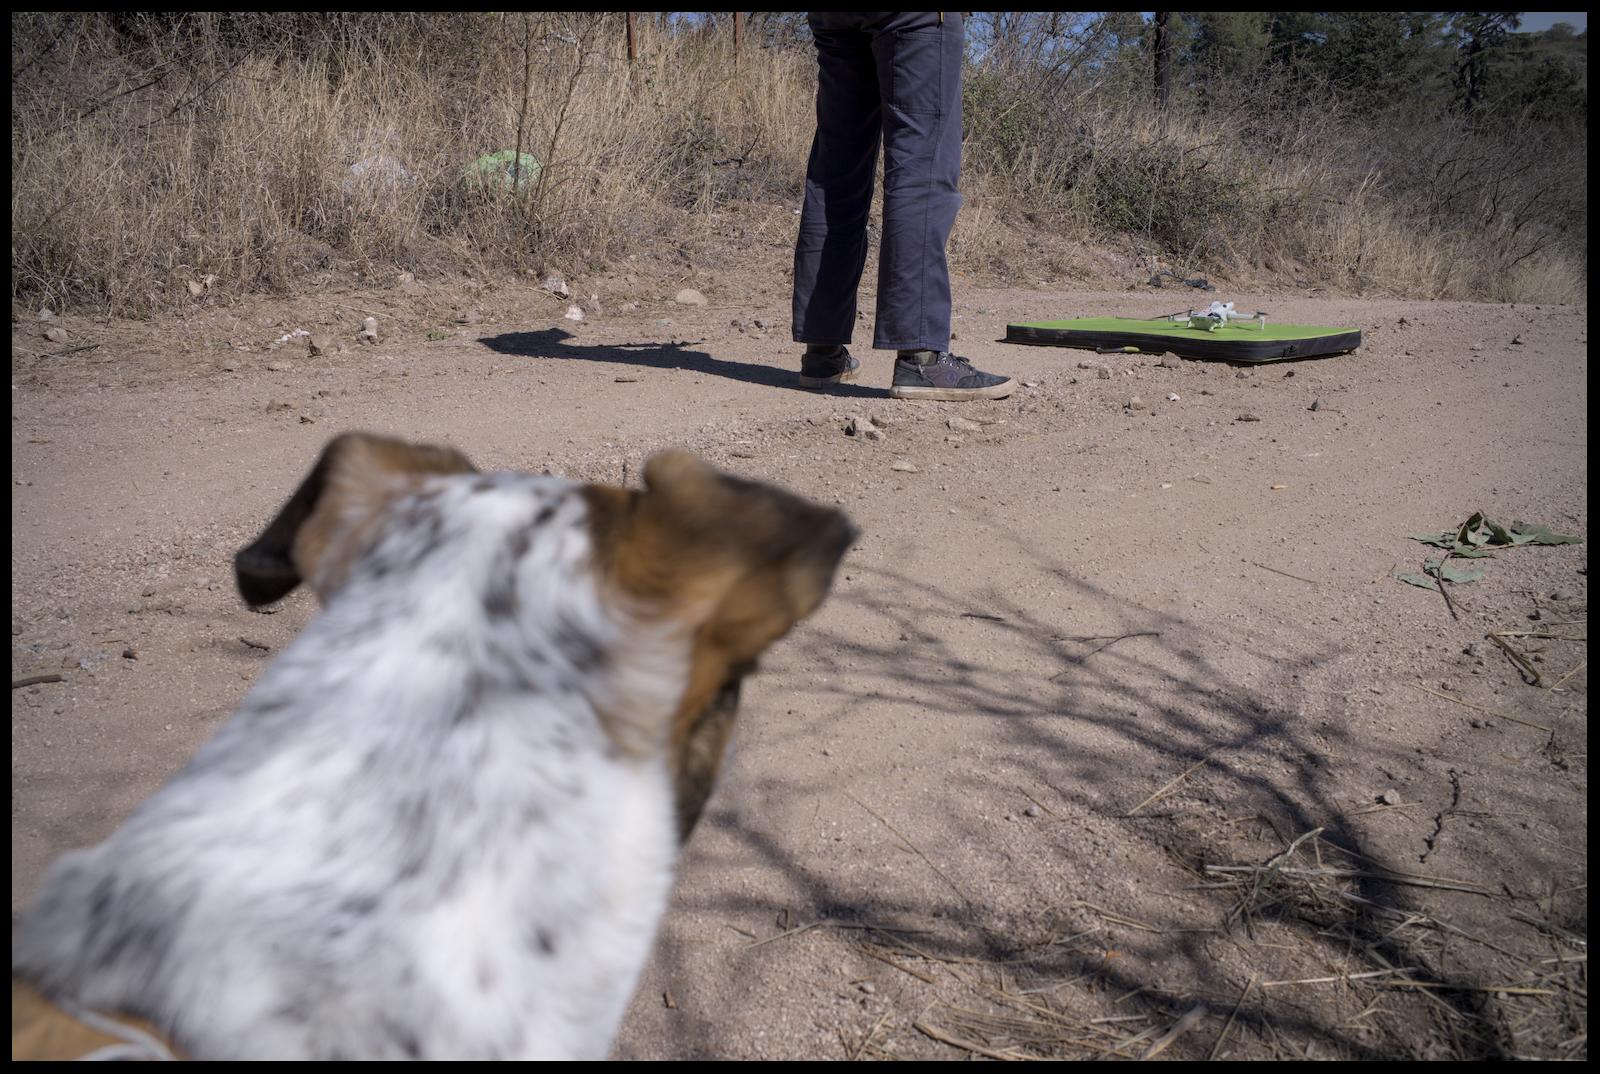
It ended up being too windy to fly drones for long. Instead we recorded street-level images for and GPS tracks, in addition to doing a lot of live surveying – using a huge range of tools that allow contributing to OSM!

In no particular order we at least used: @everydoor, @streetcomplete, @MapComplete, @CoMaps, HOTOSM's ChatMap, iD and JOSM.

Having so many different ways of making contributions is a real feature.

two people standing on a dirt road, looking up into the sky, shielding their eyes from the sun with a hand each. the left person carries a mate in the hand they use to shield their eyes. behind them is a dog looking around
ALT text

two people standing on a dirt road, looking up into the sky, shielding their eyes from the sun with a hand each. the left person carries a mate in the hand they use to shield their eyes. behind them is a dog looking around

A dog stands in the foreground slightly out of focus, looking at a drone that is sitting on a crashpad used as a launchpad in the background
ALT text

A dog stands in the foreground slightly out of focus, looking at a drone that is sitting on a crashpad used as a launchpad in the background

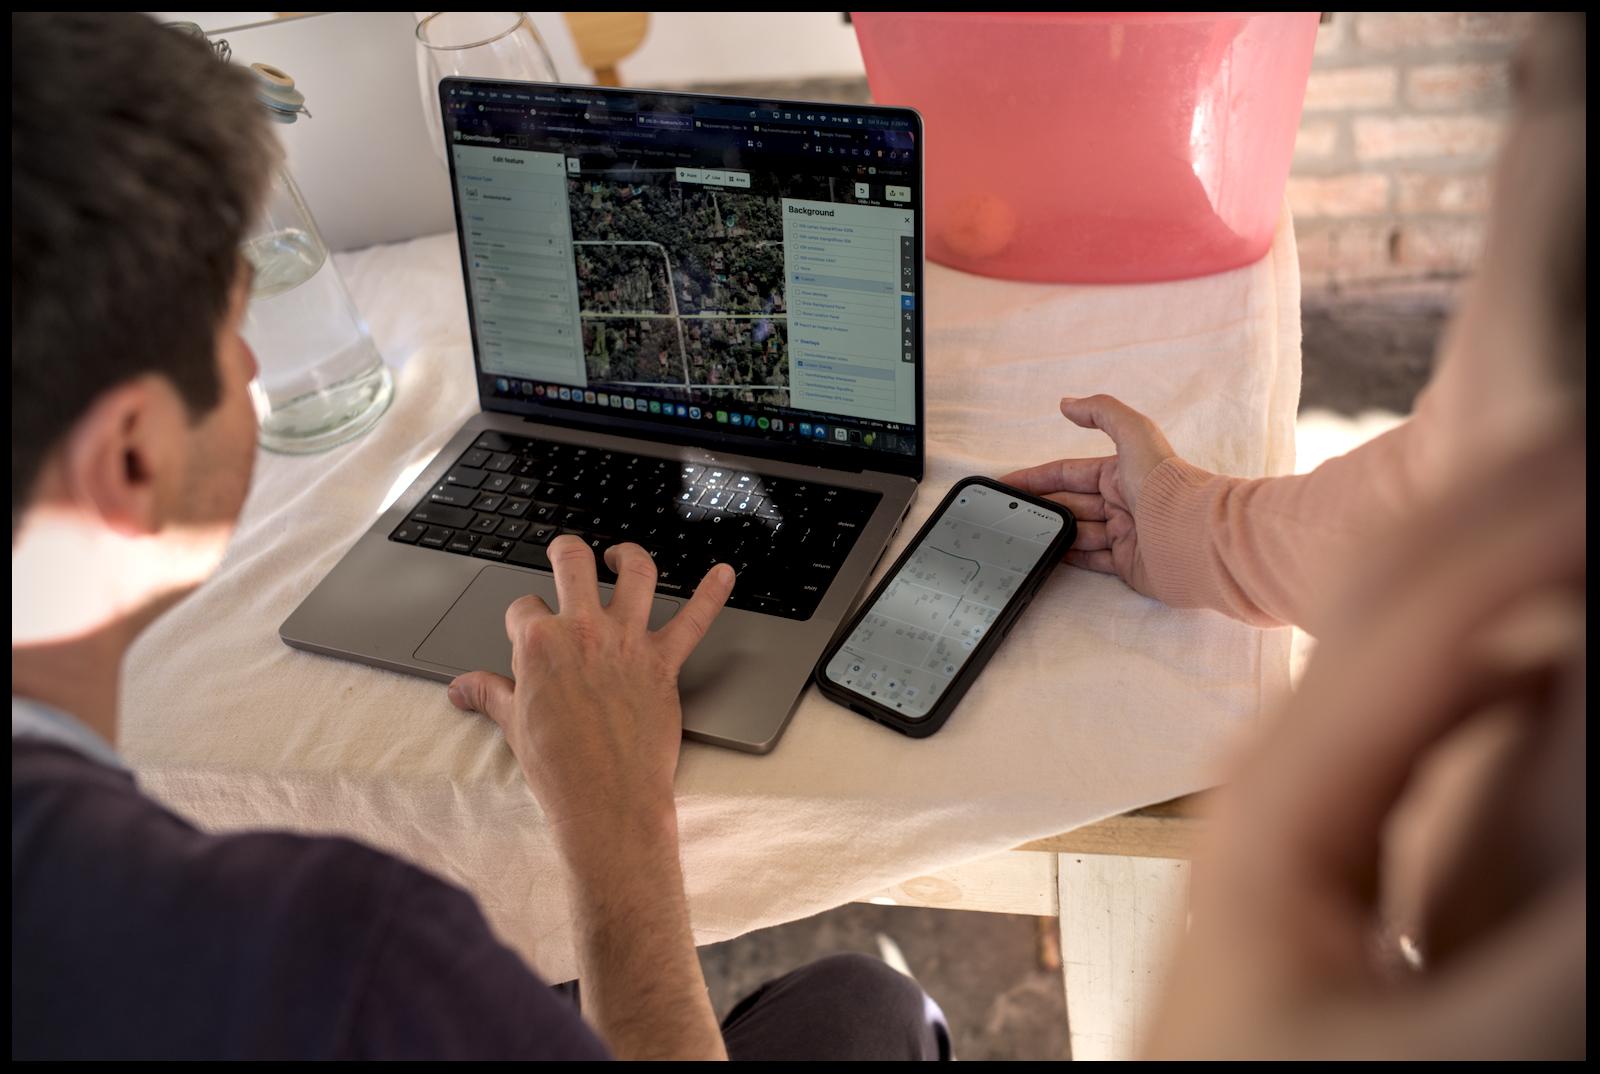
an over the shoulder view between two people who sitting/standing around a table and look at a laptop and phone that rest on the table. the laptop shows an openstreetmap editor open
ALT text

an over the shoulder view between two people who sitting/standing around a table and look at a laptop and phone that rest on the table. the laptop shows an openstreetmap editor open

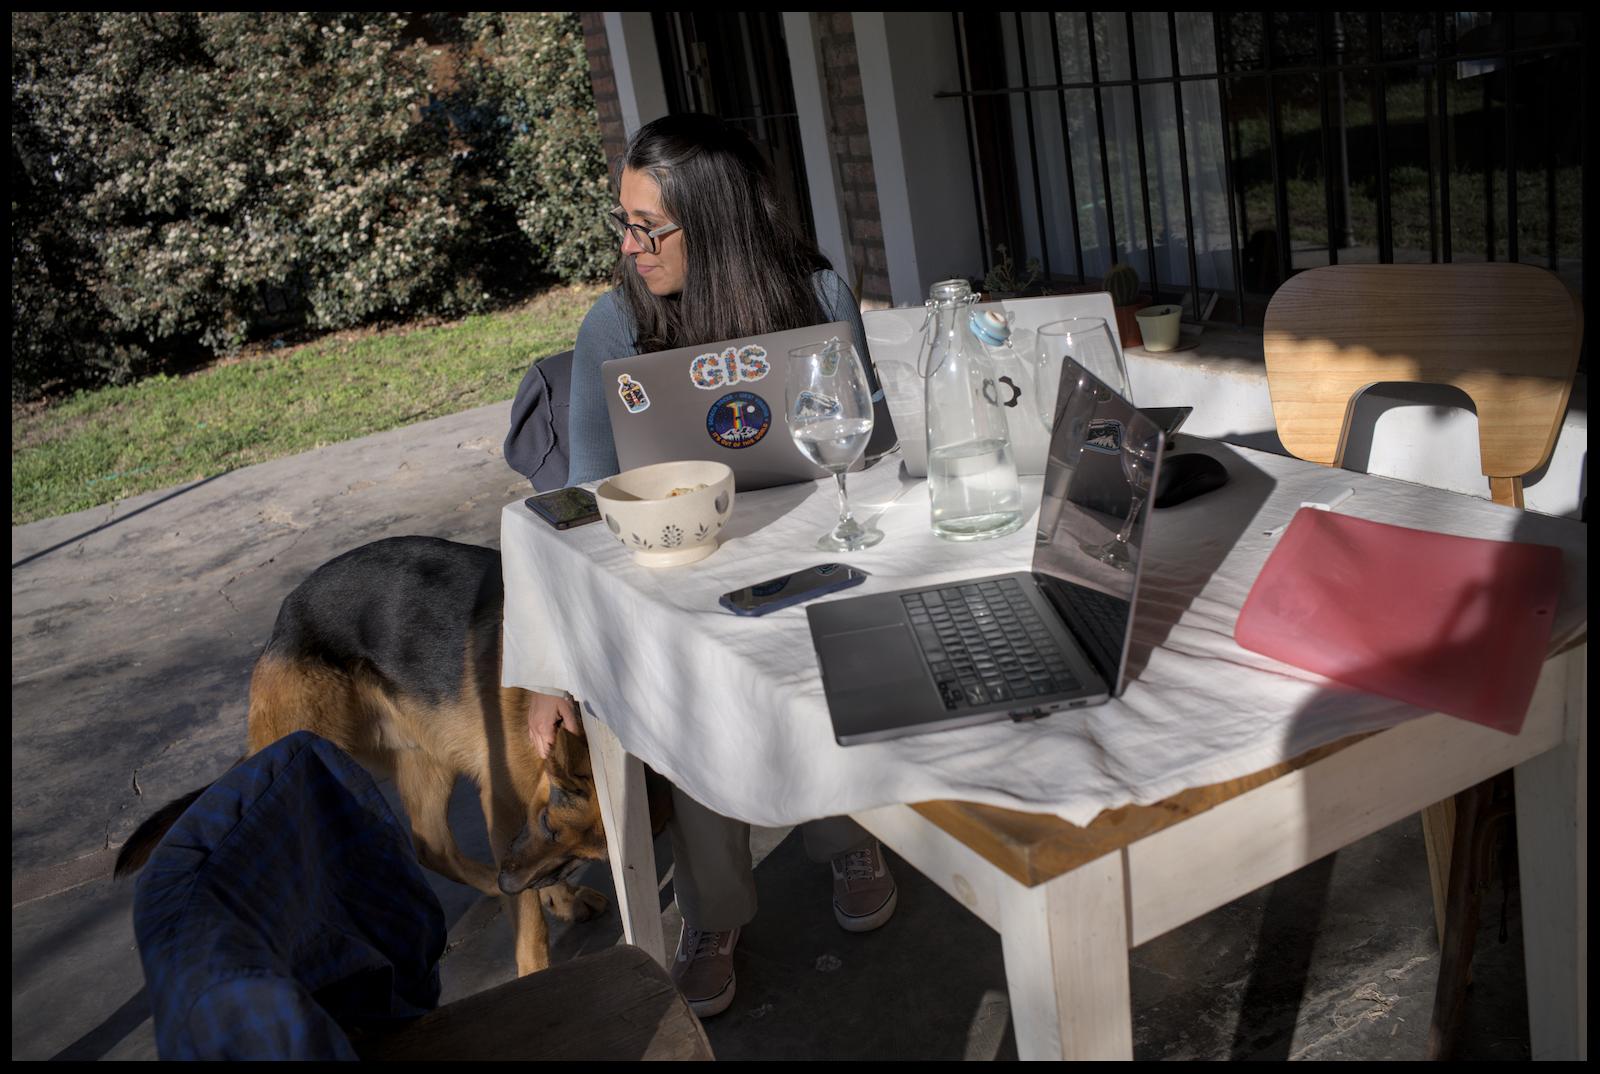
a table outside on a patio, the desk is full with laptops, one visibly with a bunch of GIS related stickers. behind that computer sits a person with a German Shepard-style dog next to them.
ALT text

a table outside on a patio, the desk is full with laptops, one visibly with a bunch of GIS related stickers. behind that computer sits a person with a German Shepard-style dog next to them.

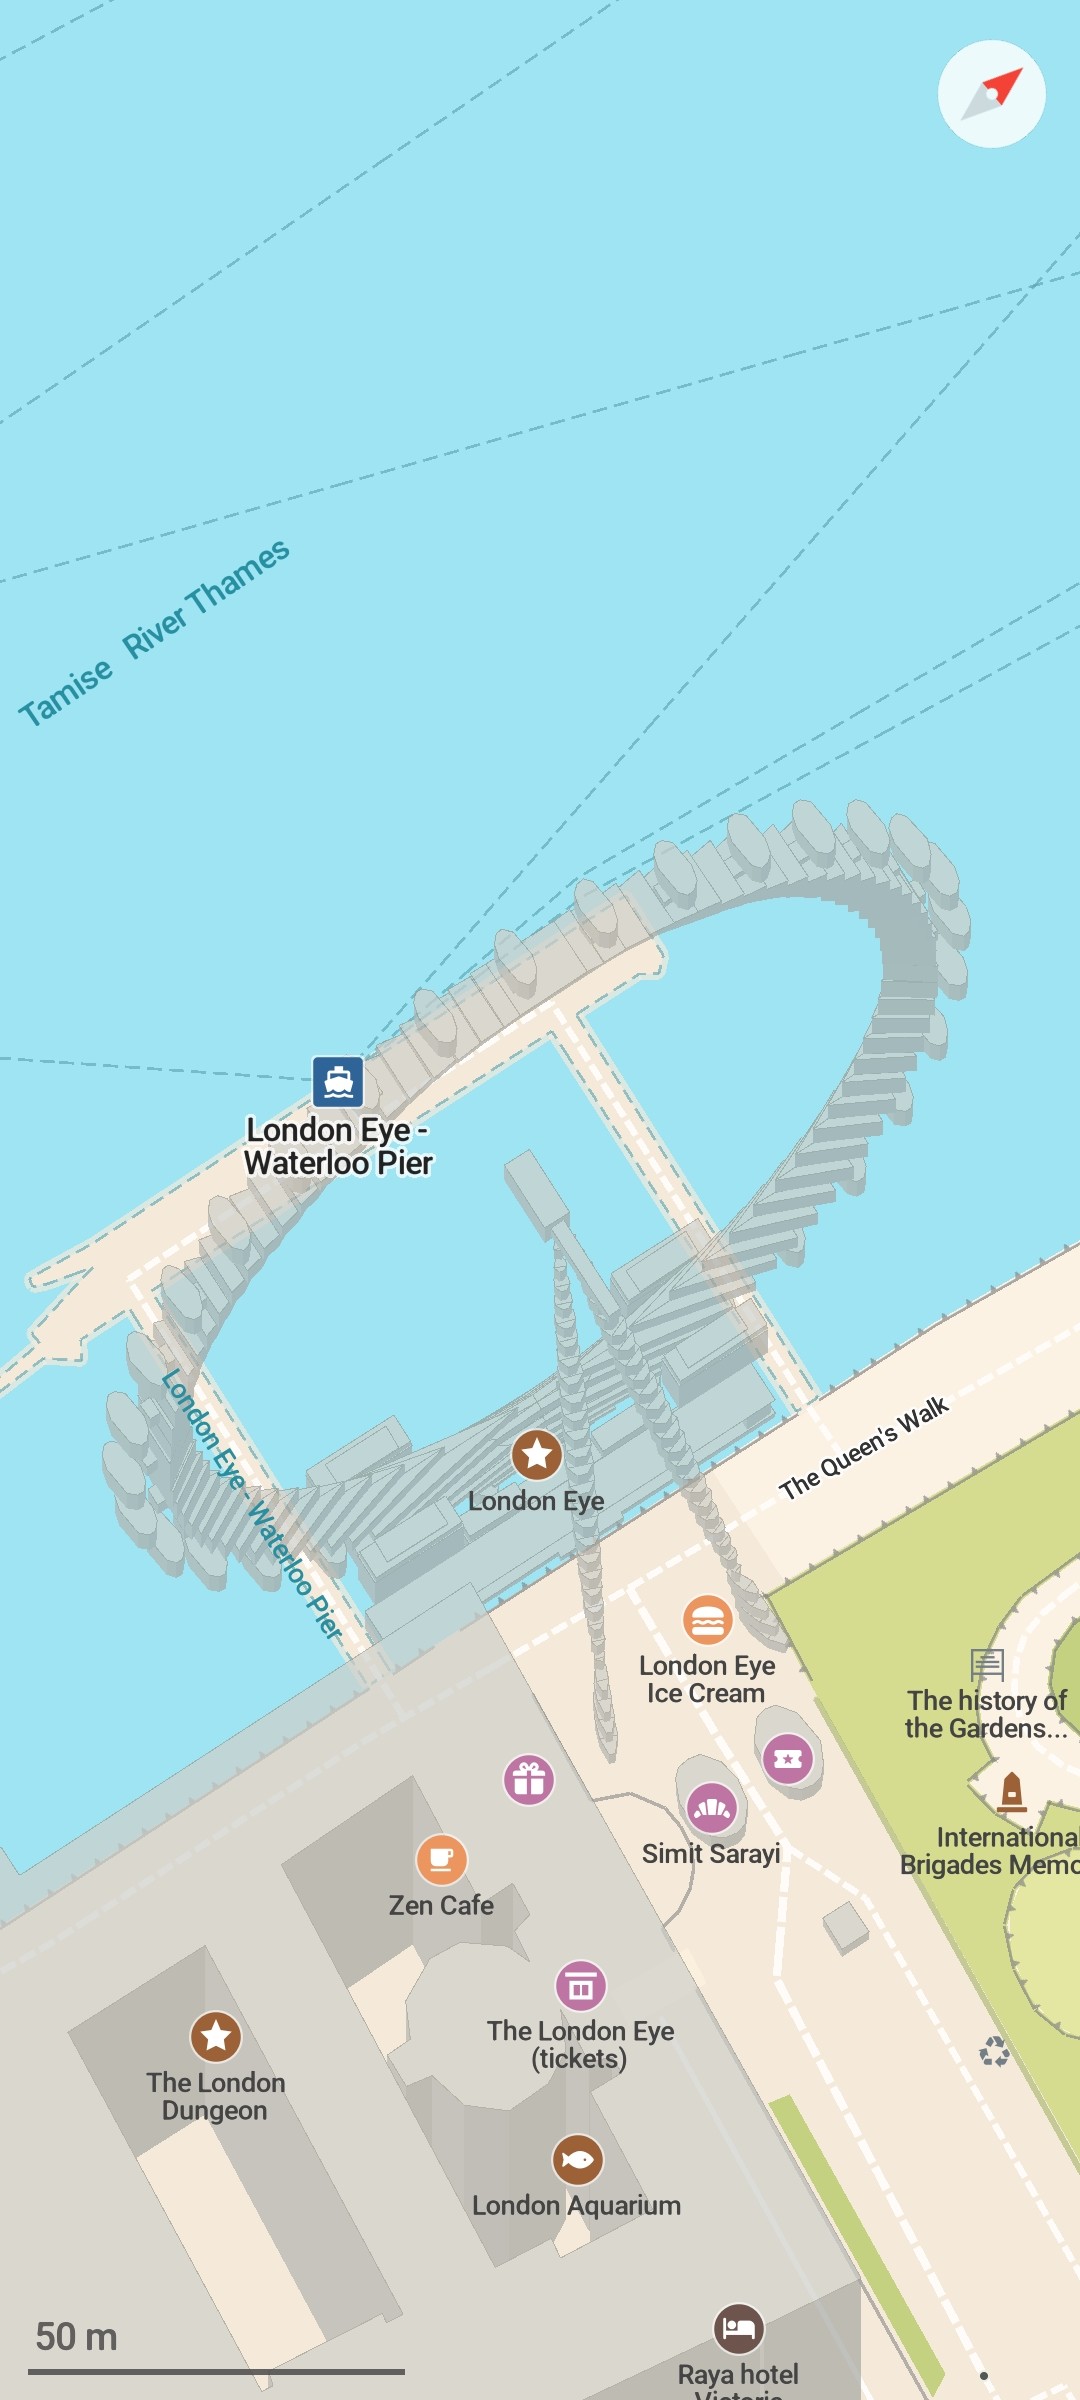
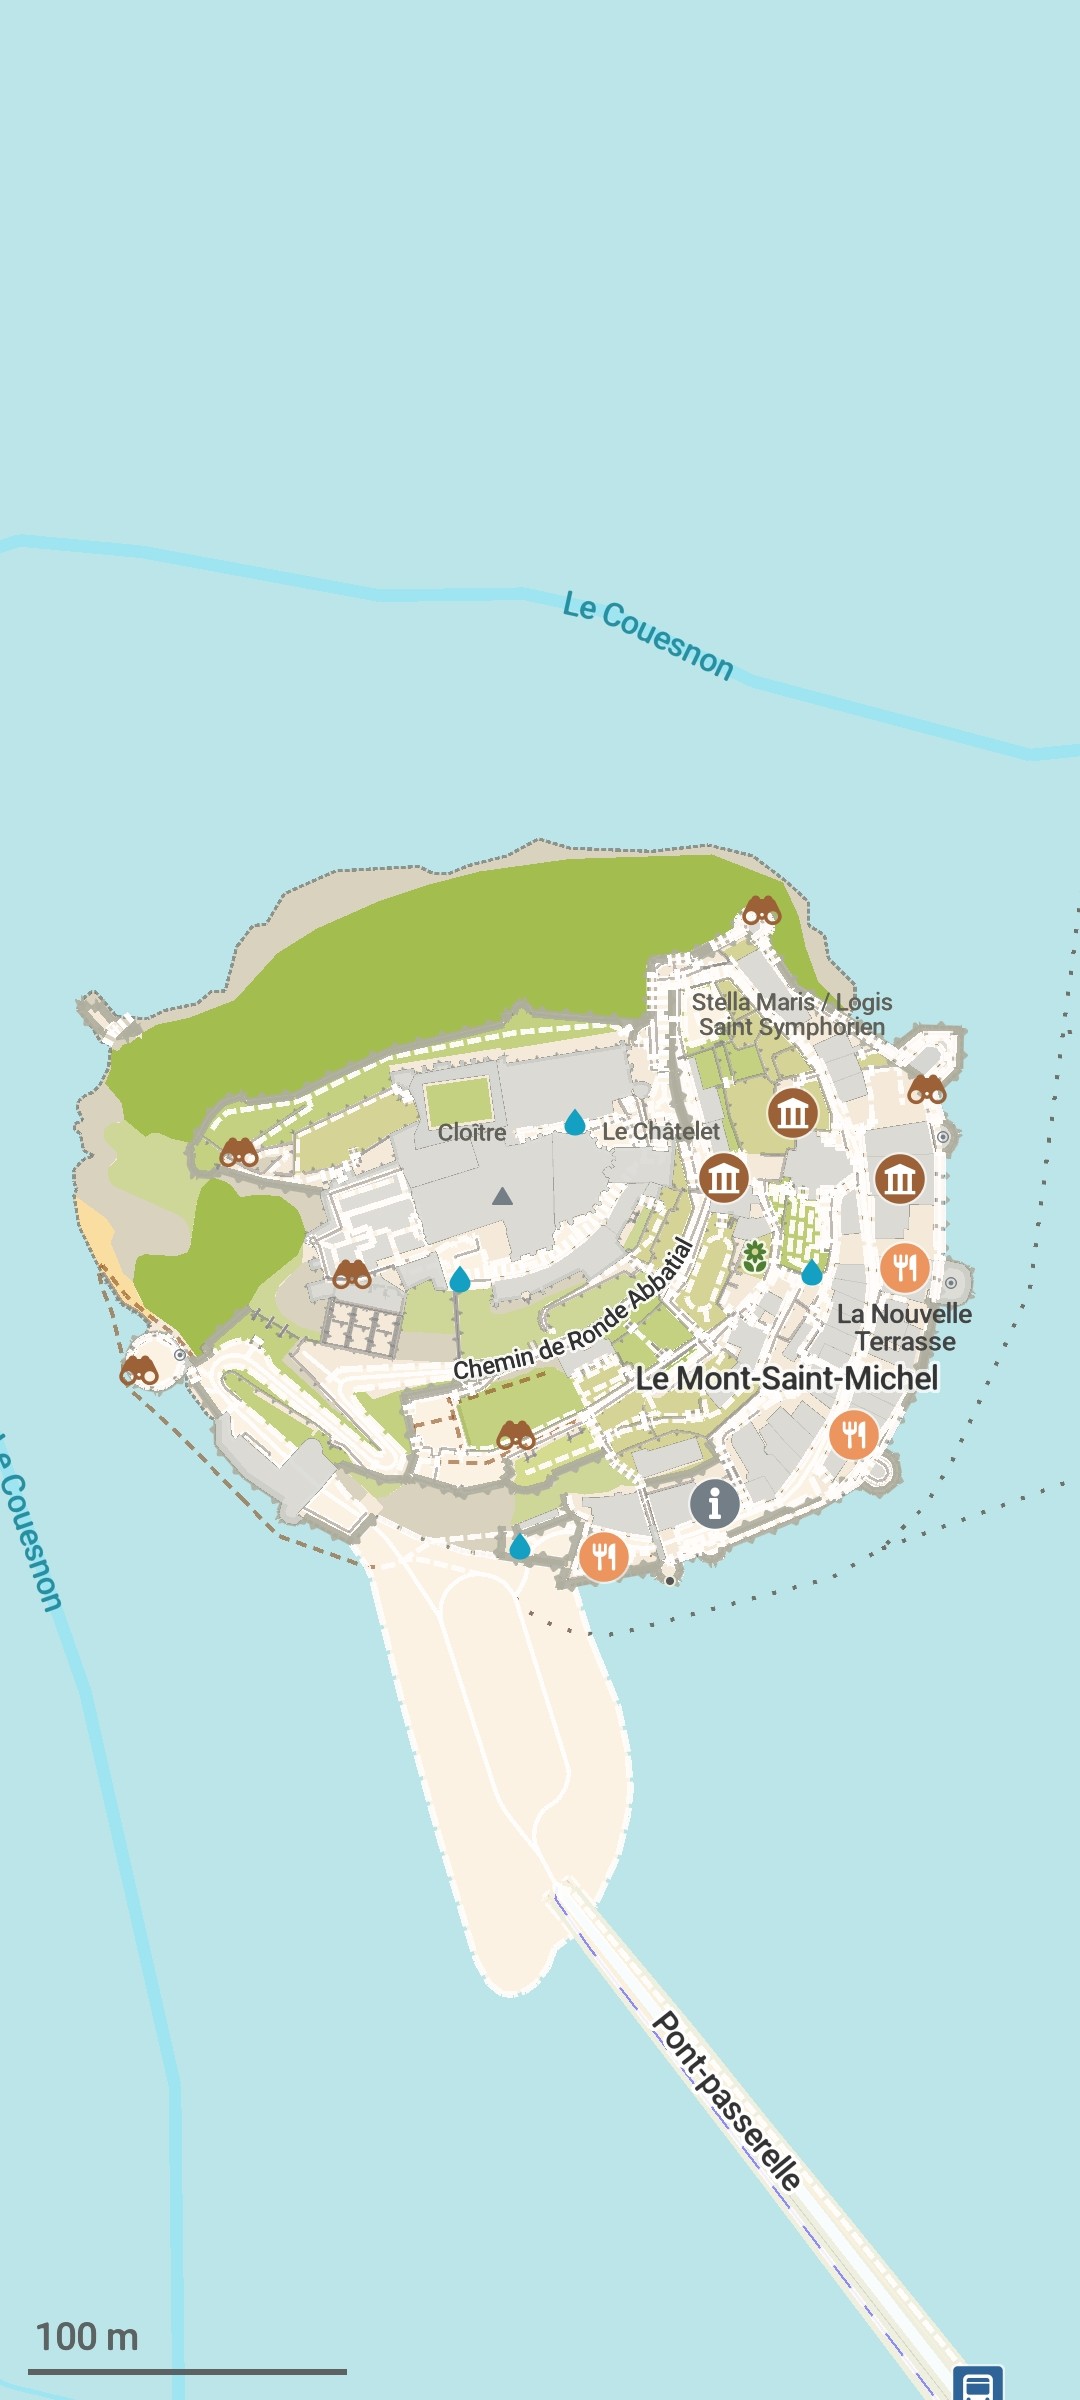
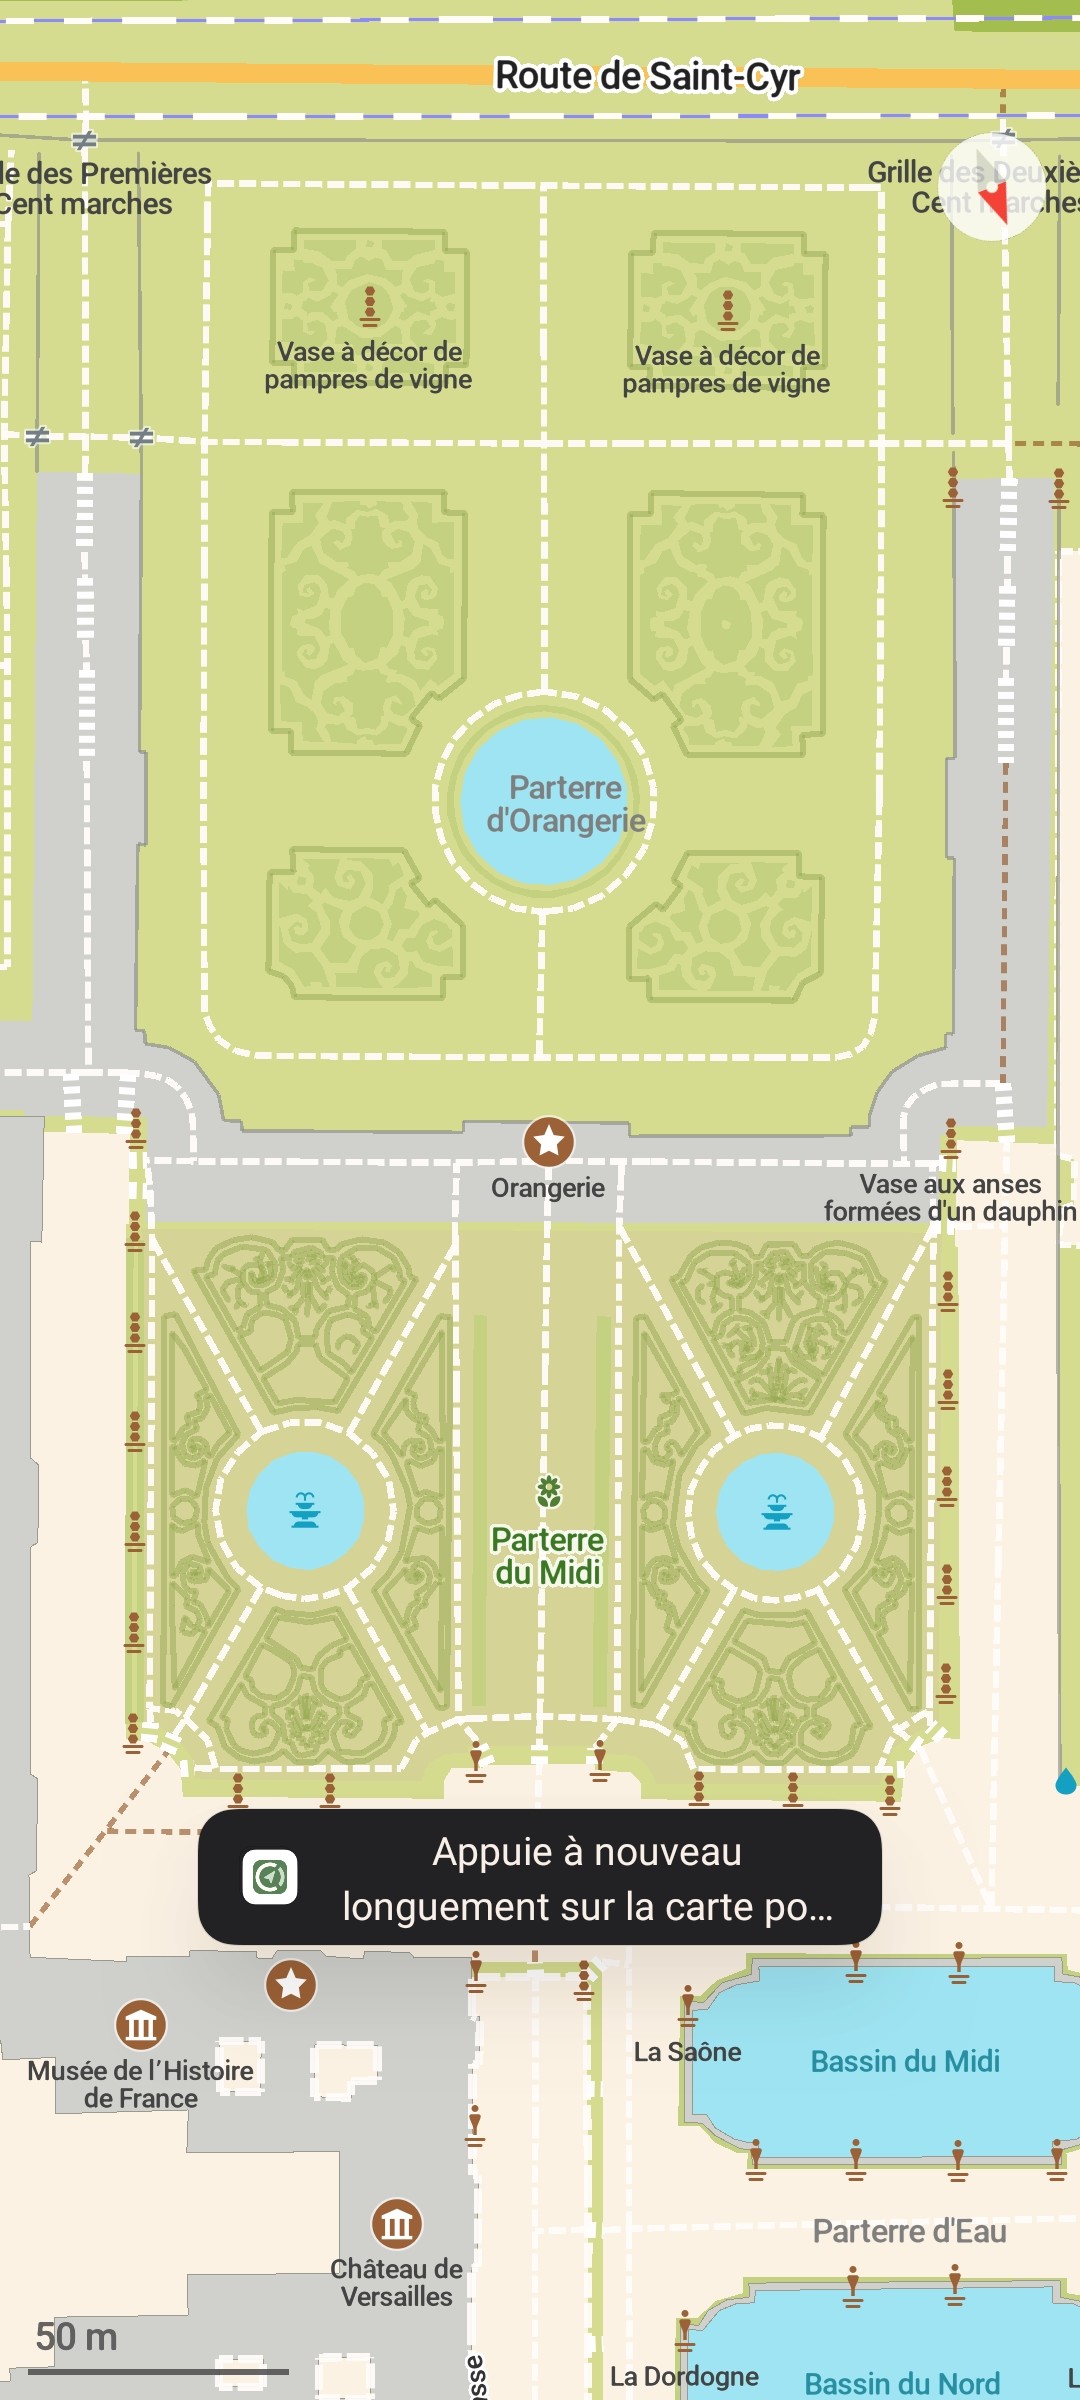
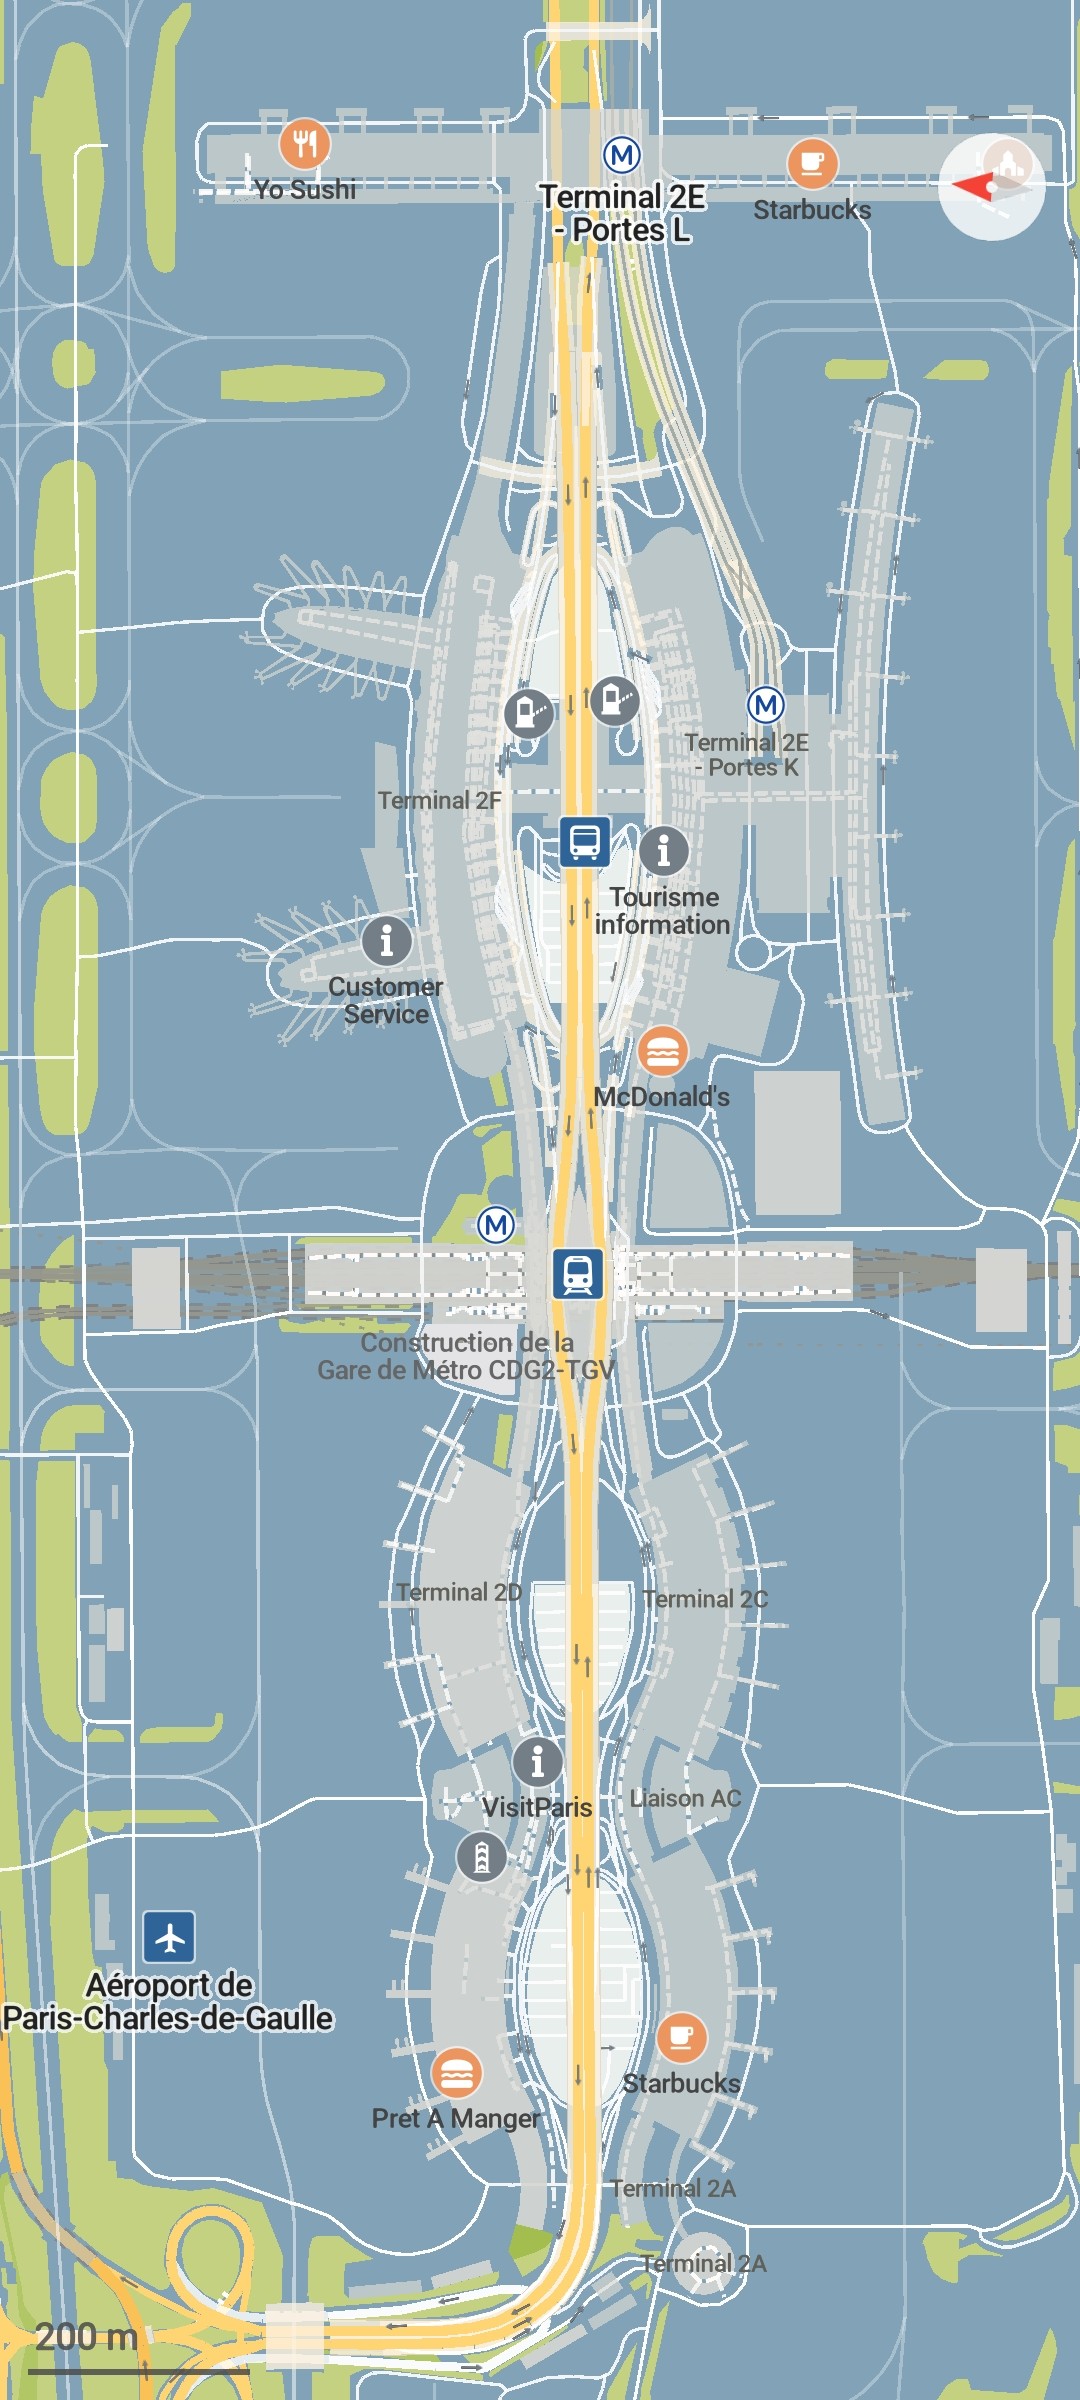
@CoMaps A small anthology beautiful on CoMaps😍:
🗺️London Eye (tricky 3D model🤯)
51.5033411,-0.1196761
🗺️Versailles jardins, le Parterre du Midi
48.8037087,2.1193341
🗺️Charles-de-Gaulle Airport, Paris
5.2293208,-52.7729604
🗺️Le Mont Saint-Michel and its bay
48.6360206,-1.5114959

CoMaps screenshot.
A city map centered on the 3D model of a Ferris wheel.
ALT text

CoMaps screenshot. A city map centered on the 3D model of a Ferris wheel.

CoMaps screenshot.
A map of Mont-Saint-Michel placed on its sky-blue colored bay. A roughly circular hill surrounded by ramparts to the south and its abbey in the centre.
ALT text

CoMaps screenshot. A map of Mont-Saint-Michel placed on its sky-blue colored bay. A roughly circular hill surrounded by ramparts to the south and its abbey in the centre.

CoMaps screenshot.
A colourful plan centred on a garden bed with delicately drawn hedges and fountains.
ALT text

CoMaps screenshot. A colourful plan centred on a garden bed with delicately drawn hedges and fountains.

CoMaps screenshot.
A map of airport terminals spreading out like birds' wings on a blue colored background.
ALT text

CoMaps screenshot. A map of airport terminals spreading out like birds' wings on a blue colored background.

Had a blast at our little birthday celebration. 🍰 🧉

It ended up being too windy to fly drones for long. Instead we recorded street-level images for and GPS tracks, in addition to doing a lot of live surveying – using a huge range of tools that allow contributing to OSM!

In no particular order we at least used: @everydoor, @streetcomplete, @MapComplete, @CoMaps, HOTOSM's ChatMap, iD and JOSM.

Having so many different ways of making contributions is a real feature.

two people standing on a dirt road, looking up into the sky, shielding their eyes from the sun with a hand each. the left person carries a mate in the hand they use to shield their eyes. behind them is a dog looking around
ALT text

two people standing on a dirt road, looking up into the sky, shielding their eyes from the sun with a hand each. the left person carries a mate in the hand they use to shield their eyes. behind them is a dog looking around

A dog stands in the foreground slightly out of focus, looking at a drone that is sitting on a crashpad used as a launchpad in the background
ALT text

A dog stands in the foreground slightly out of focus, looking at a drone that is sitting on a crashpad used as a launchpad in the background

an over the shoulder view between two people who sitting/standing around a table and look at a laptop and phone that rest on the table. the laptop shows an openstreetmap editor open
ALT text

an over the shoulder view between two people who sitting/standing around a table and look at a laptop and phone that rest on the table. the laptop shows an openstreetmap editor open

a table outside on a patio, the desk is full with laptops, one visibly with a bunch of GIS related stickers. behind that computer sits a person with a German Shepard-style dog next to them.
ALT text

a table outside on a patio, the desk is full with laptops, one visibly with a bunch of GIS related stickers. behind that computer sits a person with a German Shepard-style dog next to them.

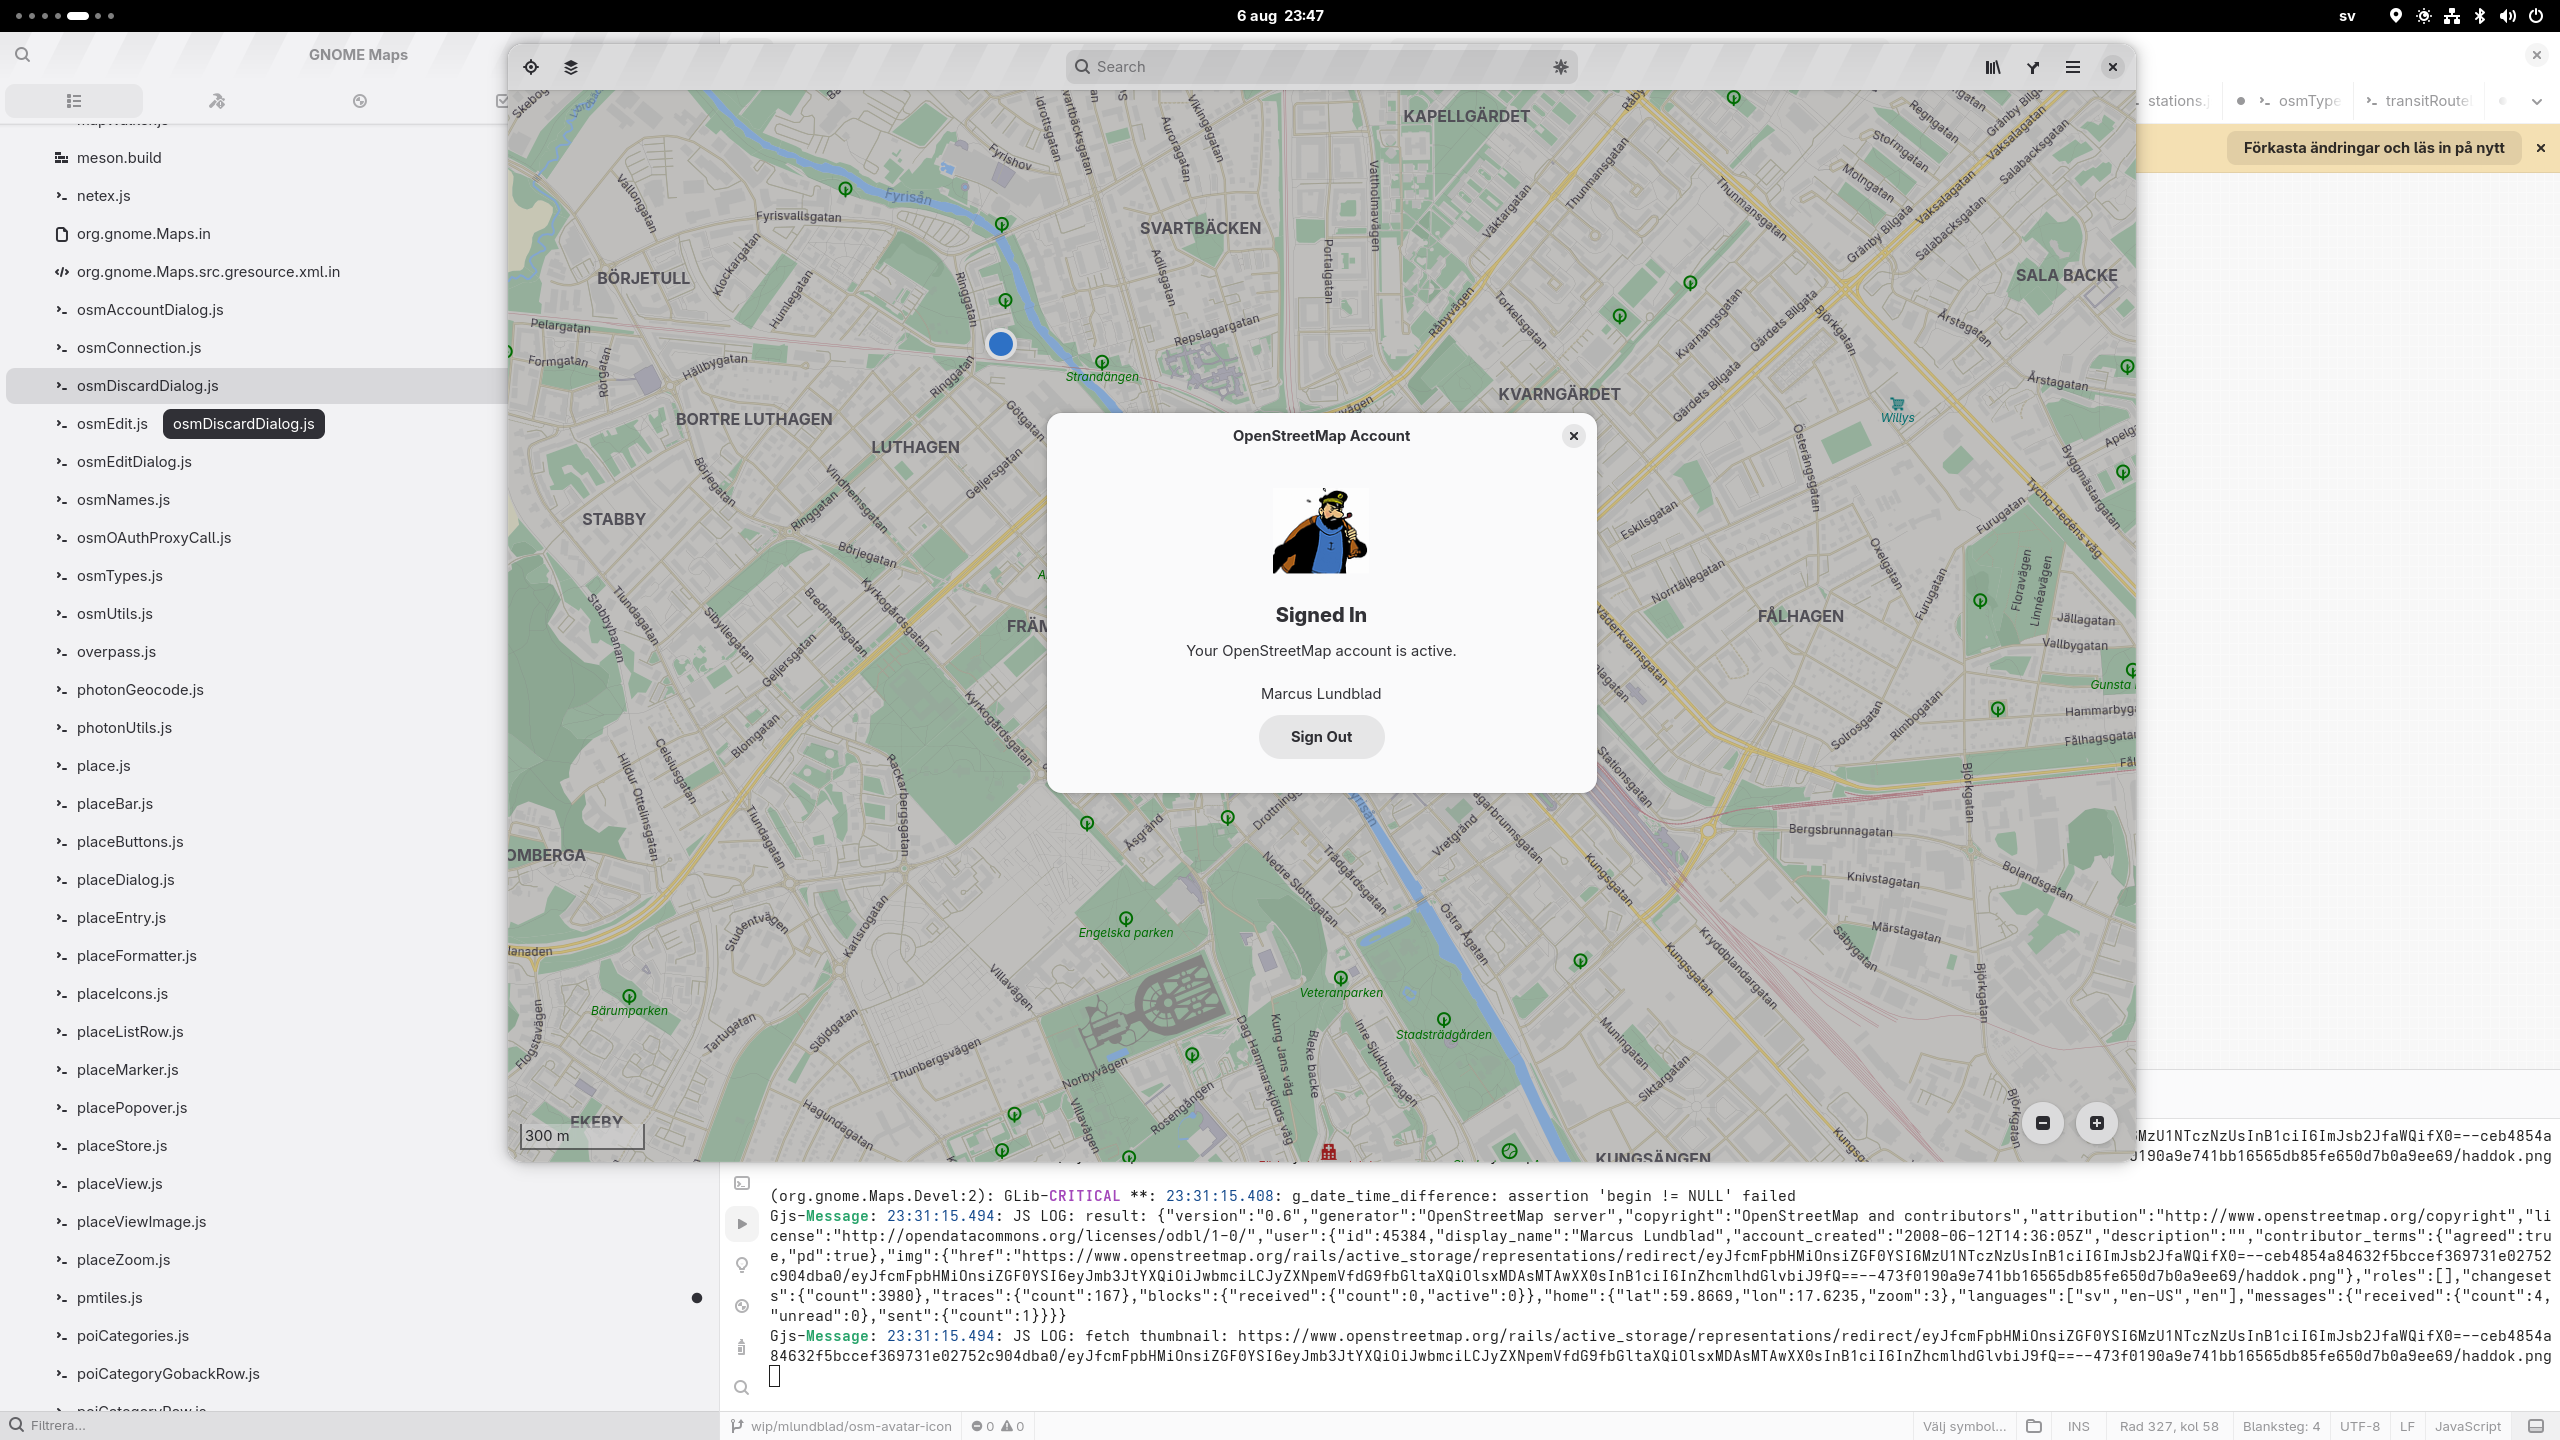
Implemented loading the user's account avatar, and displaying it in place of the "default user avatar" symbolic icon in the OpenStreetMap account setup dialog (for OAuth setup of your OSM account for editing POIs in Maps). After a suggestion by @pigeon_ about using the "user details" OSM JSON API.

Though, this will not be GNOME 49 material, as we're passed the UI freeze deadline by now…

Screenshot showing GNOME Maps showing the OpenStreetMap account setup dialog utilizing the user's custom avatar image.
ALT text

Screenshot showing GNOME Maps showing the OpenStreetMap account setup dialog utilizing the user's custom avatar image.

Je cartographie la capital du Turkménistan, Ashgabat, depuis un bon moment mais je n'ai pas encore montré ici les avant/après, voilà donc le premier de la série !

openstreetmap.org/#map=17/37.8

GIF animé d'une carte OpenStreetMap. Université Internationale du Pétrole et du Gaz à Ashgabat, au Turkménistan.

Première image : les bâtiments sont présents, il y a quelques routes mais aucune dans l'enceinte de l'école.

Deuxième image : les bâtiments sont redessinées, toutes les routes sont présentes, les terrains de sport sont bien distinguable, les zones d'herbes apparaissent avec les arbres, une œuvre d'art fait sont apparition au sud-est, et la barrière de l'enceinte de l'école est présente.
ALT text

GIF animé d'une carte OpenStreetMap. Université Internationale du Pétrole et du Gaz à Ashgabat, au Turkménistan. Première image : les bâtiments sont présents, il y a quelques routes mais aucune dans l'enceinte de l'école. Deuxième image : les bâtiments sont redessinées, toutes les routes sont présentes, les terrains de sport sont bien distinguable, les zones d'herbes apparaissent avec les arbres, une œuvre d'art fait sont apparition au sud-est, et la barrière de l'enceinte de l'école est présente.

GIF animé d'une carte OpenStreetMap. Université Internationale du Pétrole et du Gaz à Ashgabat, au Turkménistan.

Première image : les bâtiments sont présents, il y a quelques routes mais aucune dans l'enceinte de l'école.

Deuxième image : les bâtiments sont redessinées, toutes les routes sont présentes, les terrains de sport sont bien distinguable, les zones d'herbes apparaissent avec les arbres, une œuvre d'art fait sont apparition au sud-est, et la barrière de l'enceinte de l'école est présente.
ALT text

GIF animé d'une carte OpenStreetMap. Université Internationale du Pétrole et du Gaz à Ashgabat, au Turkménistan. Première image : les bâtiments sont présents, il y a quelques routes mais aucune dans l'enceinte de l'école. Deuxième image : les bâtiments sont redessinées, toutes les routes sont présentes, les terrains de sport sont bien distinguable, les zones d'herbes apparaissent avec les arbres, une œuvre d'art fait sont apparition au sud-est, et la barrière de l'enceinte de l'école est présente.

"Je crois que cette zone avait besoin d'un peu de détail" be like !
Pour une fois c'est un avant/après en France !

openstreetmap.org/#map=18/47.1

GIF animé d'une carte OpenStreetMap, sur le site de l'Association Saint Benoit Labre à Vertou près de Nantes, en France.

Première image : les routes, les bâtiments et la zone résidentielle sont présents.

Deuxième image : Plusieurs objets sont redessinés, d'autres sont rajoutés, comme les tables de pique nique, les serres horticoles, les arbres, les barrières, les parkings et parking vélo, les portes d'entrée des bâtiments, et les champs à l'est de la zone et le bois au nord, etc. !
ALT text

GIF animé d'une carte OpenStreetMap, sur le site de l'Association Saint Benoit Labre à Vertou près de Nantes, en France. Première image : les routes, les bâtiments et la zone résidentielle sont présents. Deuxième image : Plusieurs objets sont redessinés, d'autres sont rajoutés, comme les tables de pique nique, les serres horticoles, les arbres, les barrières, les parkings et parking vélo, les portes d'entrée des bâtiments, et les champs à l'est de la zone et le bois au nord, etc. !

Carto de l'ile Rungna au cœur de Pyongyang.

Bon on voit pas très bien, mais regardez-moi cette belle cartounette openstreetmap.org/#map=16/39.0 !

GIF animé d'une carte OpenStreetMap. L'ile de Rungna au milieu du fleuve Taedong qui traverse Pyongyang.

Première image : L'ile, les routes et les bâtiments sont présents.

Deuxième image : De nombreux détails apparaissent sur l'ile comme des zones d'herbes, d'arbres, des barrières, des chemins !
ALT text

GIF animé d'une carte OpenStreetMap. L'ile de Rungna au milieu du fleuve Taedong qui traverse Pyongyang. Première image : L'ile, les routes et les bâtiments sont présents. Deuxième image : De nombreux détails apparaissent sur l'ile comme des zones d'herbes, d'arbres, des barrières, des chemins !

Playing a bit with trying to implement indoor mapping support in libshumate (and ultimatly in Maps):

gitlab.gnome.org/GNOME/libshum

So far, one can manually edit a hard-coded value (in shumate/shumate-vector-renderer.c) and run the libshumate demo app, selecting the "OSM Liberty" map source alternative.

So, don't expect anything mature soon… 😄

gitlab.gnome.org

Files · wip/mlundblad/indoor-levels · GNOME / libshumate · GitLab

Shumate is a GTK toolkit providing widgets for embedded maps.

New (Northern hemisphere) summer blog post on news in Maps

ml4711.blogspot.com/2025/06/mi

Covering some new features, a bug fix by @flyingpimonster, and a new feature where I did some live user testing by @dmark 😎

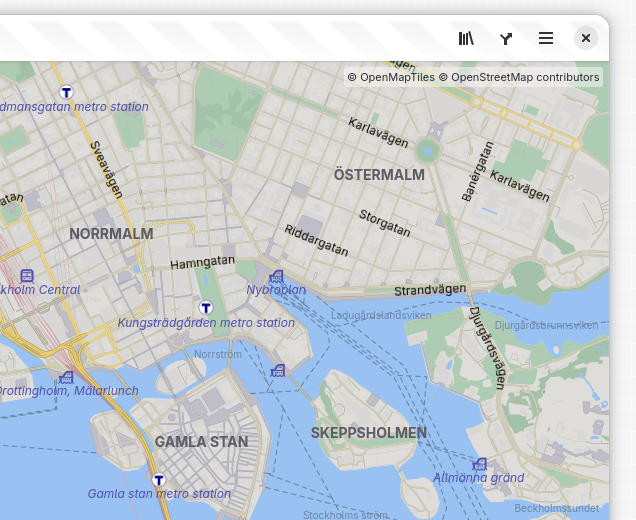
GNOME Maps showing a view of central Stockholm with some metro stations showing with the “T” logo.
ALT text

GNOME Maps showing a view of central Stockholm with some metro stations showing with the “T” logo.

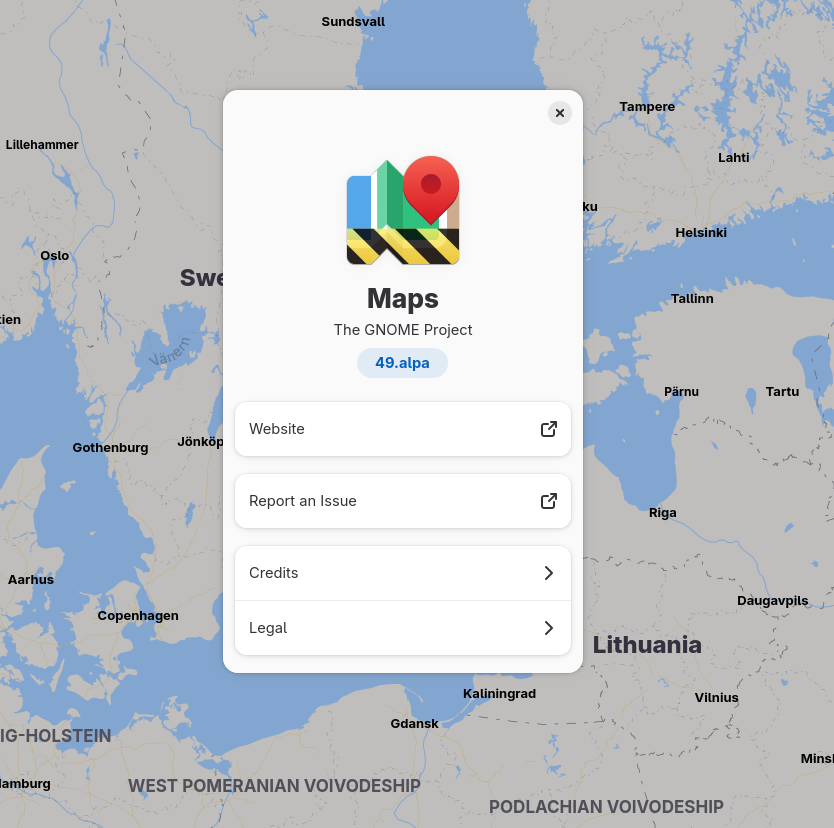
Showing about dialog for GNOME Maps 49.alpha.
ALT text

Showing about dialog for GNOME Maps 49.alpha.

GNOME Maps showing a view of central Stockholm with some metro stations showing with the “T” logo.
ALT text

GNOME Maps showing a view of central Stockholm with some metro stations showing with the “T” logo.

New (Northern hemisphere) summer blog post on news in Maps

ml4711.blogspot.com/2025/06/mi

Covering some new features, a bug fix by @flyingpimonster, and a new feature where I did some live user testing by @dmark 😎

GNOME Maps showing a view of central Stockholm with some metro stations showing with the “T” logo.
ALT text

GNOME Maps showing a view of central Stockholm with some metro stations showing with the “T” logo.

Showing about dialog for GNOME Maps 49.alpha.
ALT text

Showing about dialog for GNOME Maps 49.alpha.

GNOME Maps showing a view of central Stockholm with some metro stations showing with the “T” logo.
ALT text

GNOME Maps showing a view of central Stockholm with some metro stations showing with the “T” logo.

A public agency here (Madison, WI, USA) is planning to collect street level imagery and give it to Google. I don't know what the details of the arrangement are, but I want to advocate for also releasing the data as so that it can be used for etc. Are there any good models I can mention? I remember the Vermont DOT partner, but that was a long time ago (maybe before the FB acquisition) vtrans.vermont.gov/working/vid

vtrans.vermont.gov

Mapillary (Video Logs) - Road Imagery Viewer | Agency of Transportation

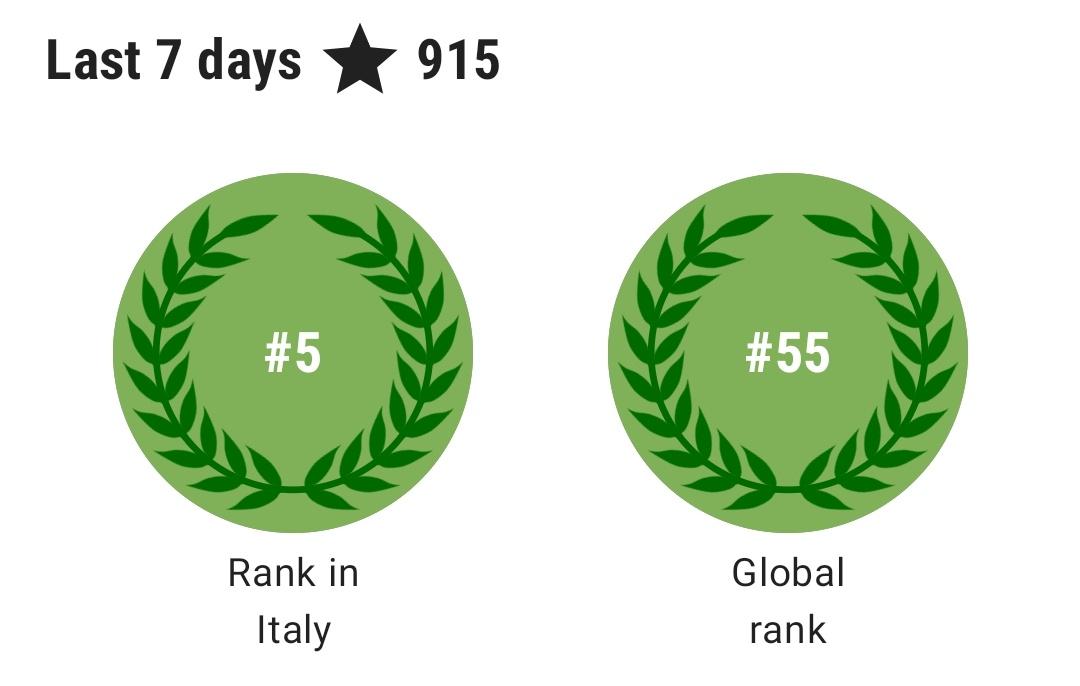
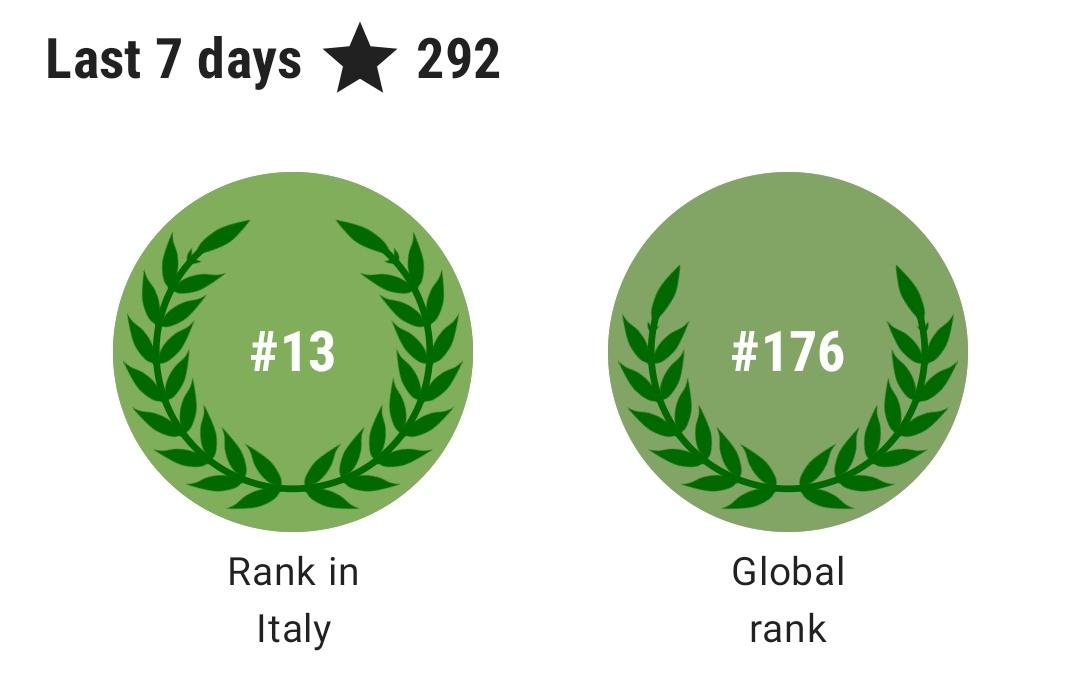
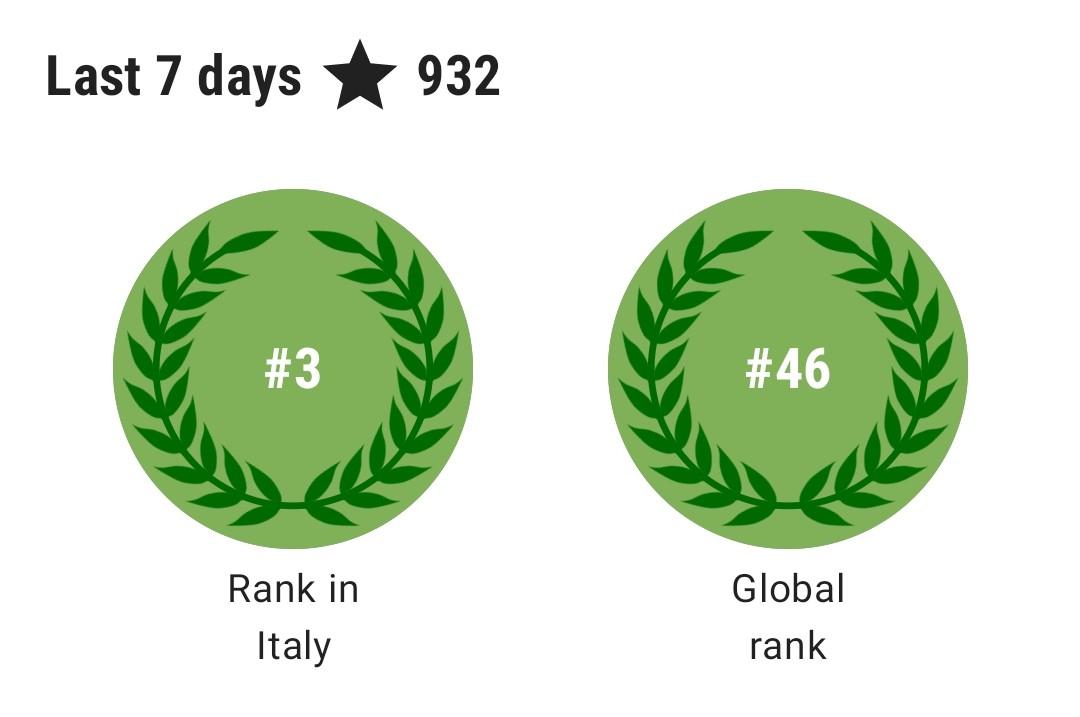
To be honest: I'm a little shocked how relatively little it takes, to climb that high in local and even global ranks.

I always assumed the top ranks are occupied by some ultra high-activity commercial mappers, group accounts etc., but this might be just a very thin layer on top.

Screenshot from StreetComplete's profile. Showing:
- Last 7 days
- Rank in Italy: #3
- Global rank: #46
ALT text

Screenshot from StreetComplete's profile. Showing: - Last 7 days - Rank in Italy: #3 - Global rank: #46

Cartographie de l'ilot Tudan-do à Pyongyang

Est-ce qu'on doit appeler ça une ile, un ilot ou c'est aucun des deux ? (une presqu'ile ?)

openstreetmap.org/#map=15/38.9

GIF animé d'une carte OpenStreetMap, ilot (ou ile) de Tudan-do, au sud-ouest de Pyongyang.

Première image : De nombreux bâtiments, et la principale route d'accès est cartographié avec la plupart des zones d'eaux.

Deuxième image : les bâtiments manquants sont rajoutés, tous les chemins, toutes les zones d'eau sont complétés, les zones agricoles sont rajoutées !
ALT text

GIF animé d'une carte OpenStreetMap, ilot (ou ile) de Tudan-do, au sud-ouest de Pyongyang. Première image : De nombreux bâtiments, et la principale route d'accès est cartographié avec la plupart des zones d'eaux. Deuxième image : les bâtiments manquants sont rajoutés, tous les chemins, toutes les zones d'eau sont complétés, les zones agricoles sont rajoutées !

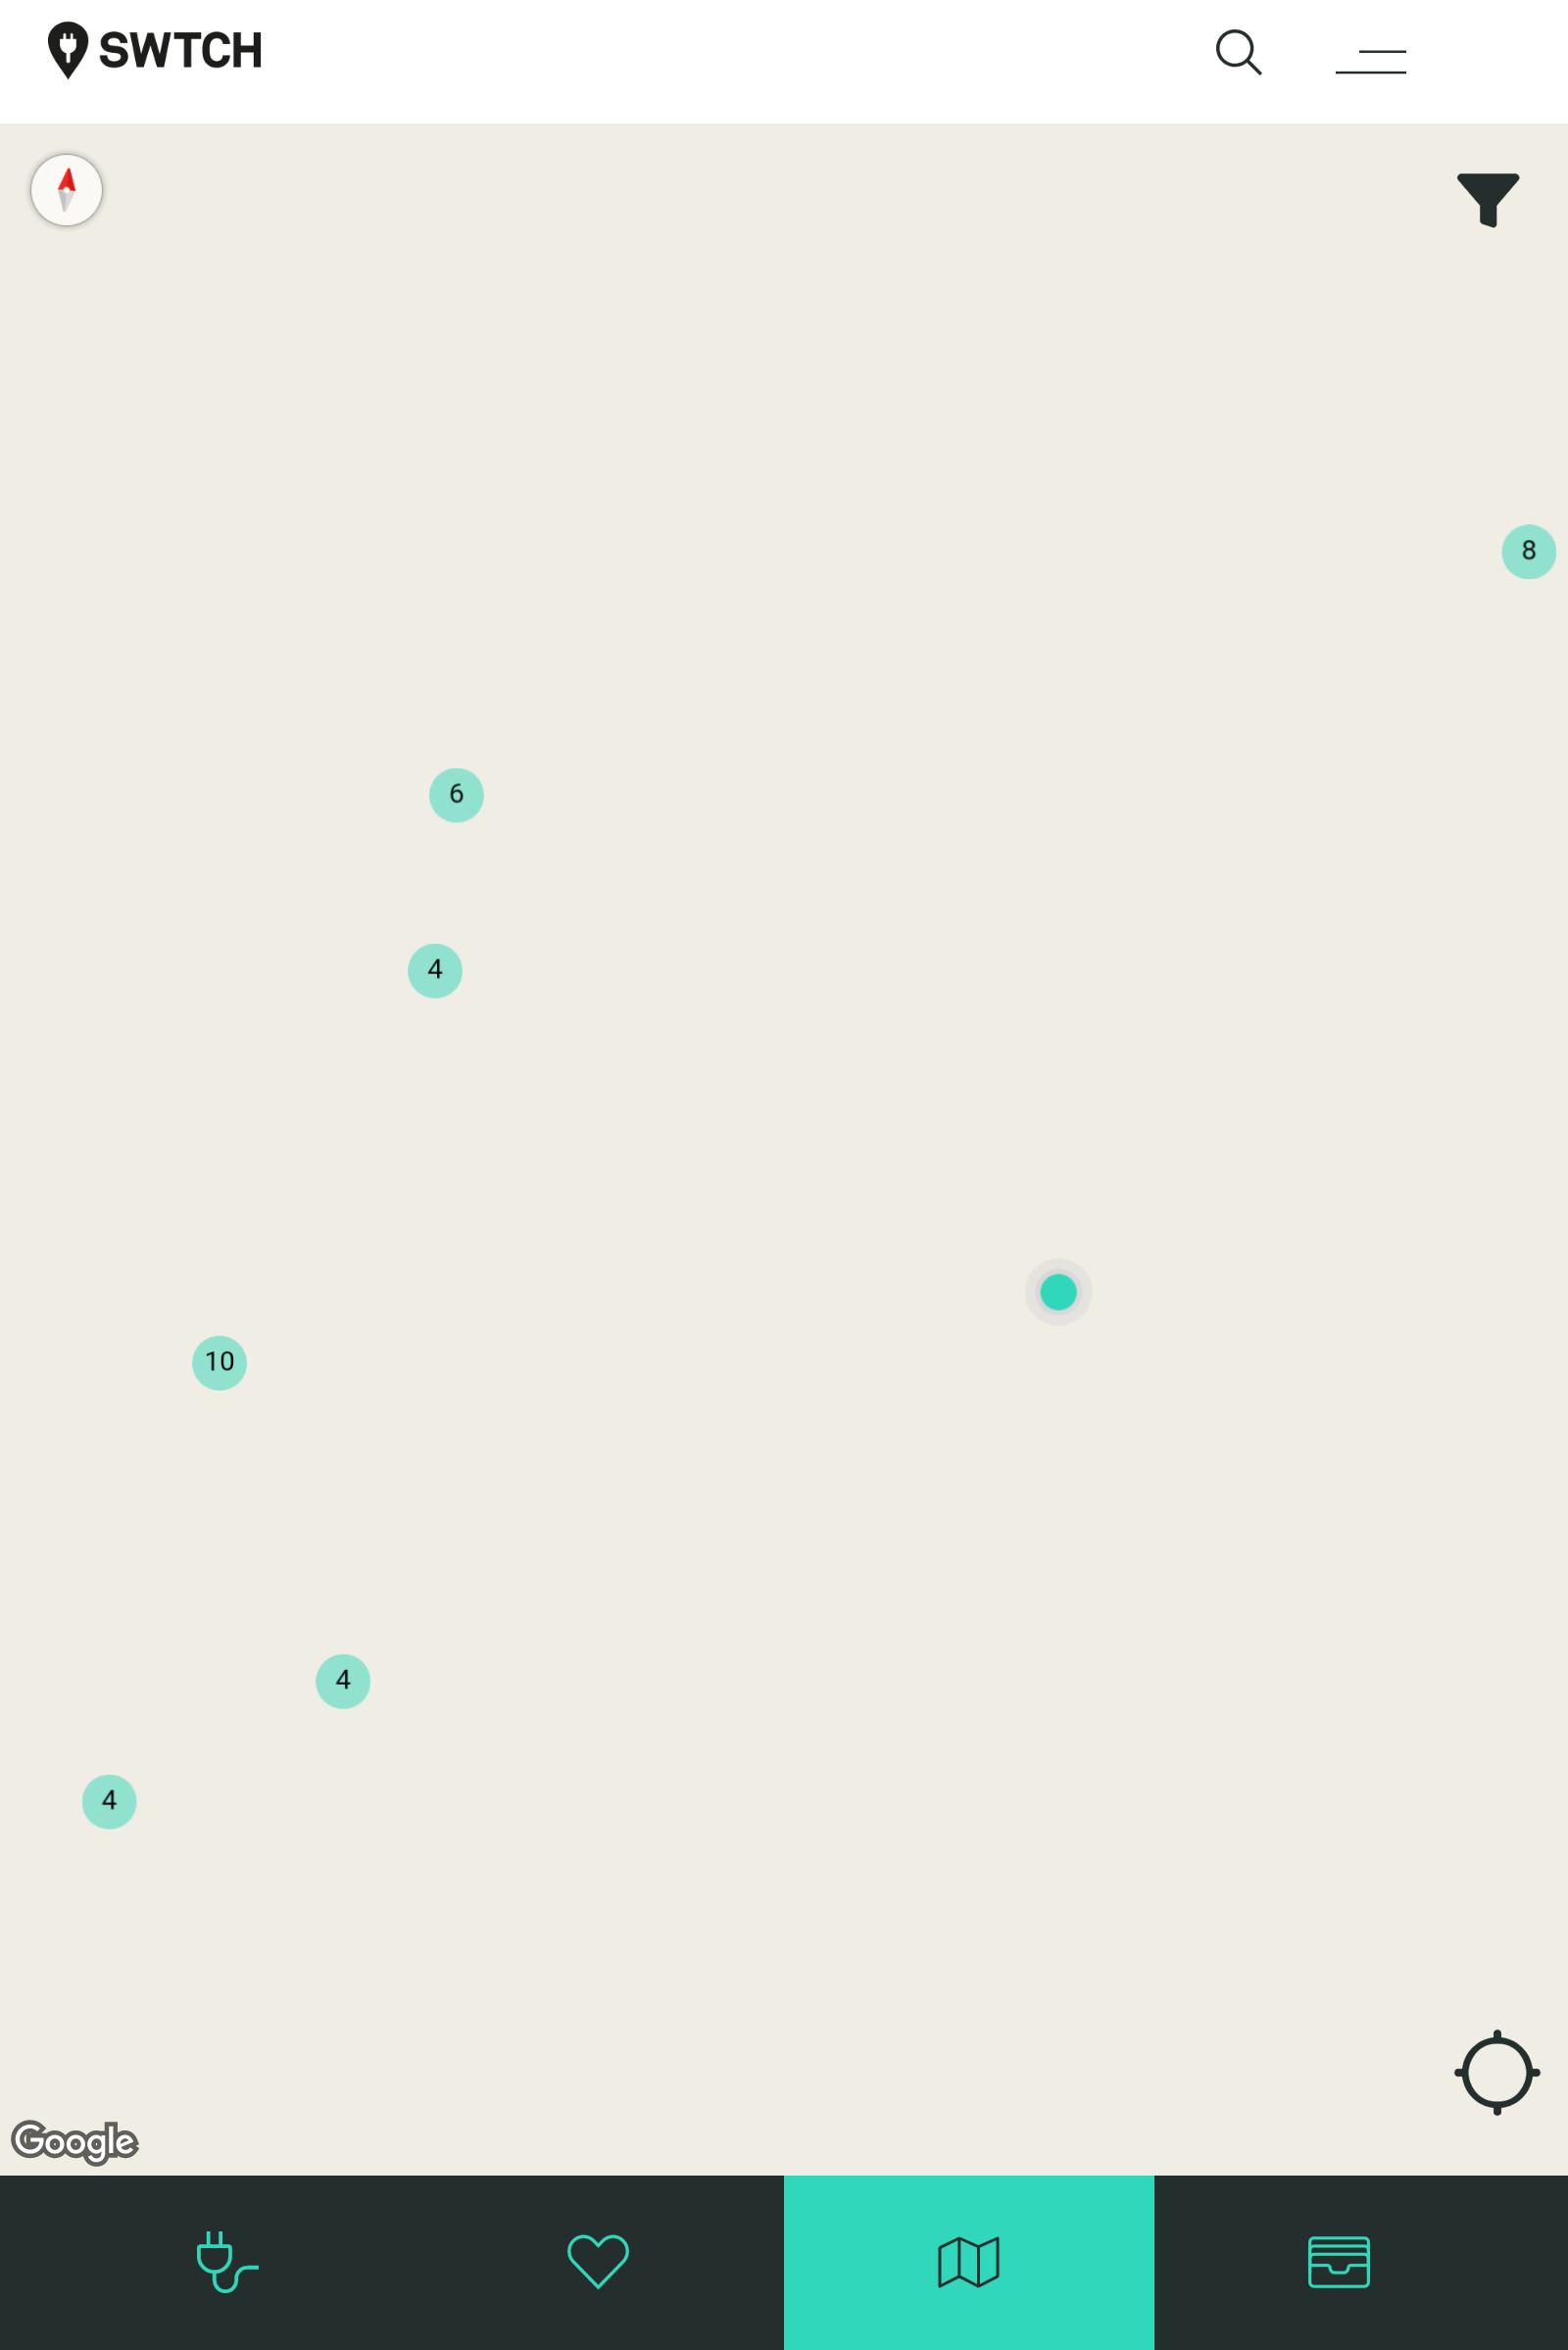
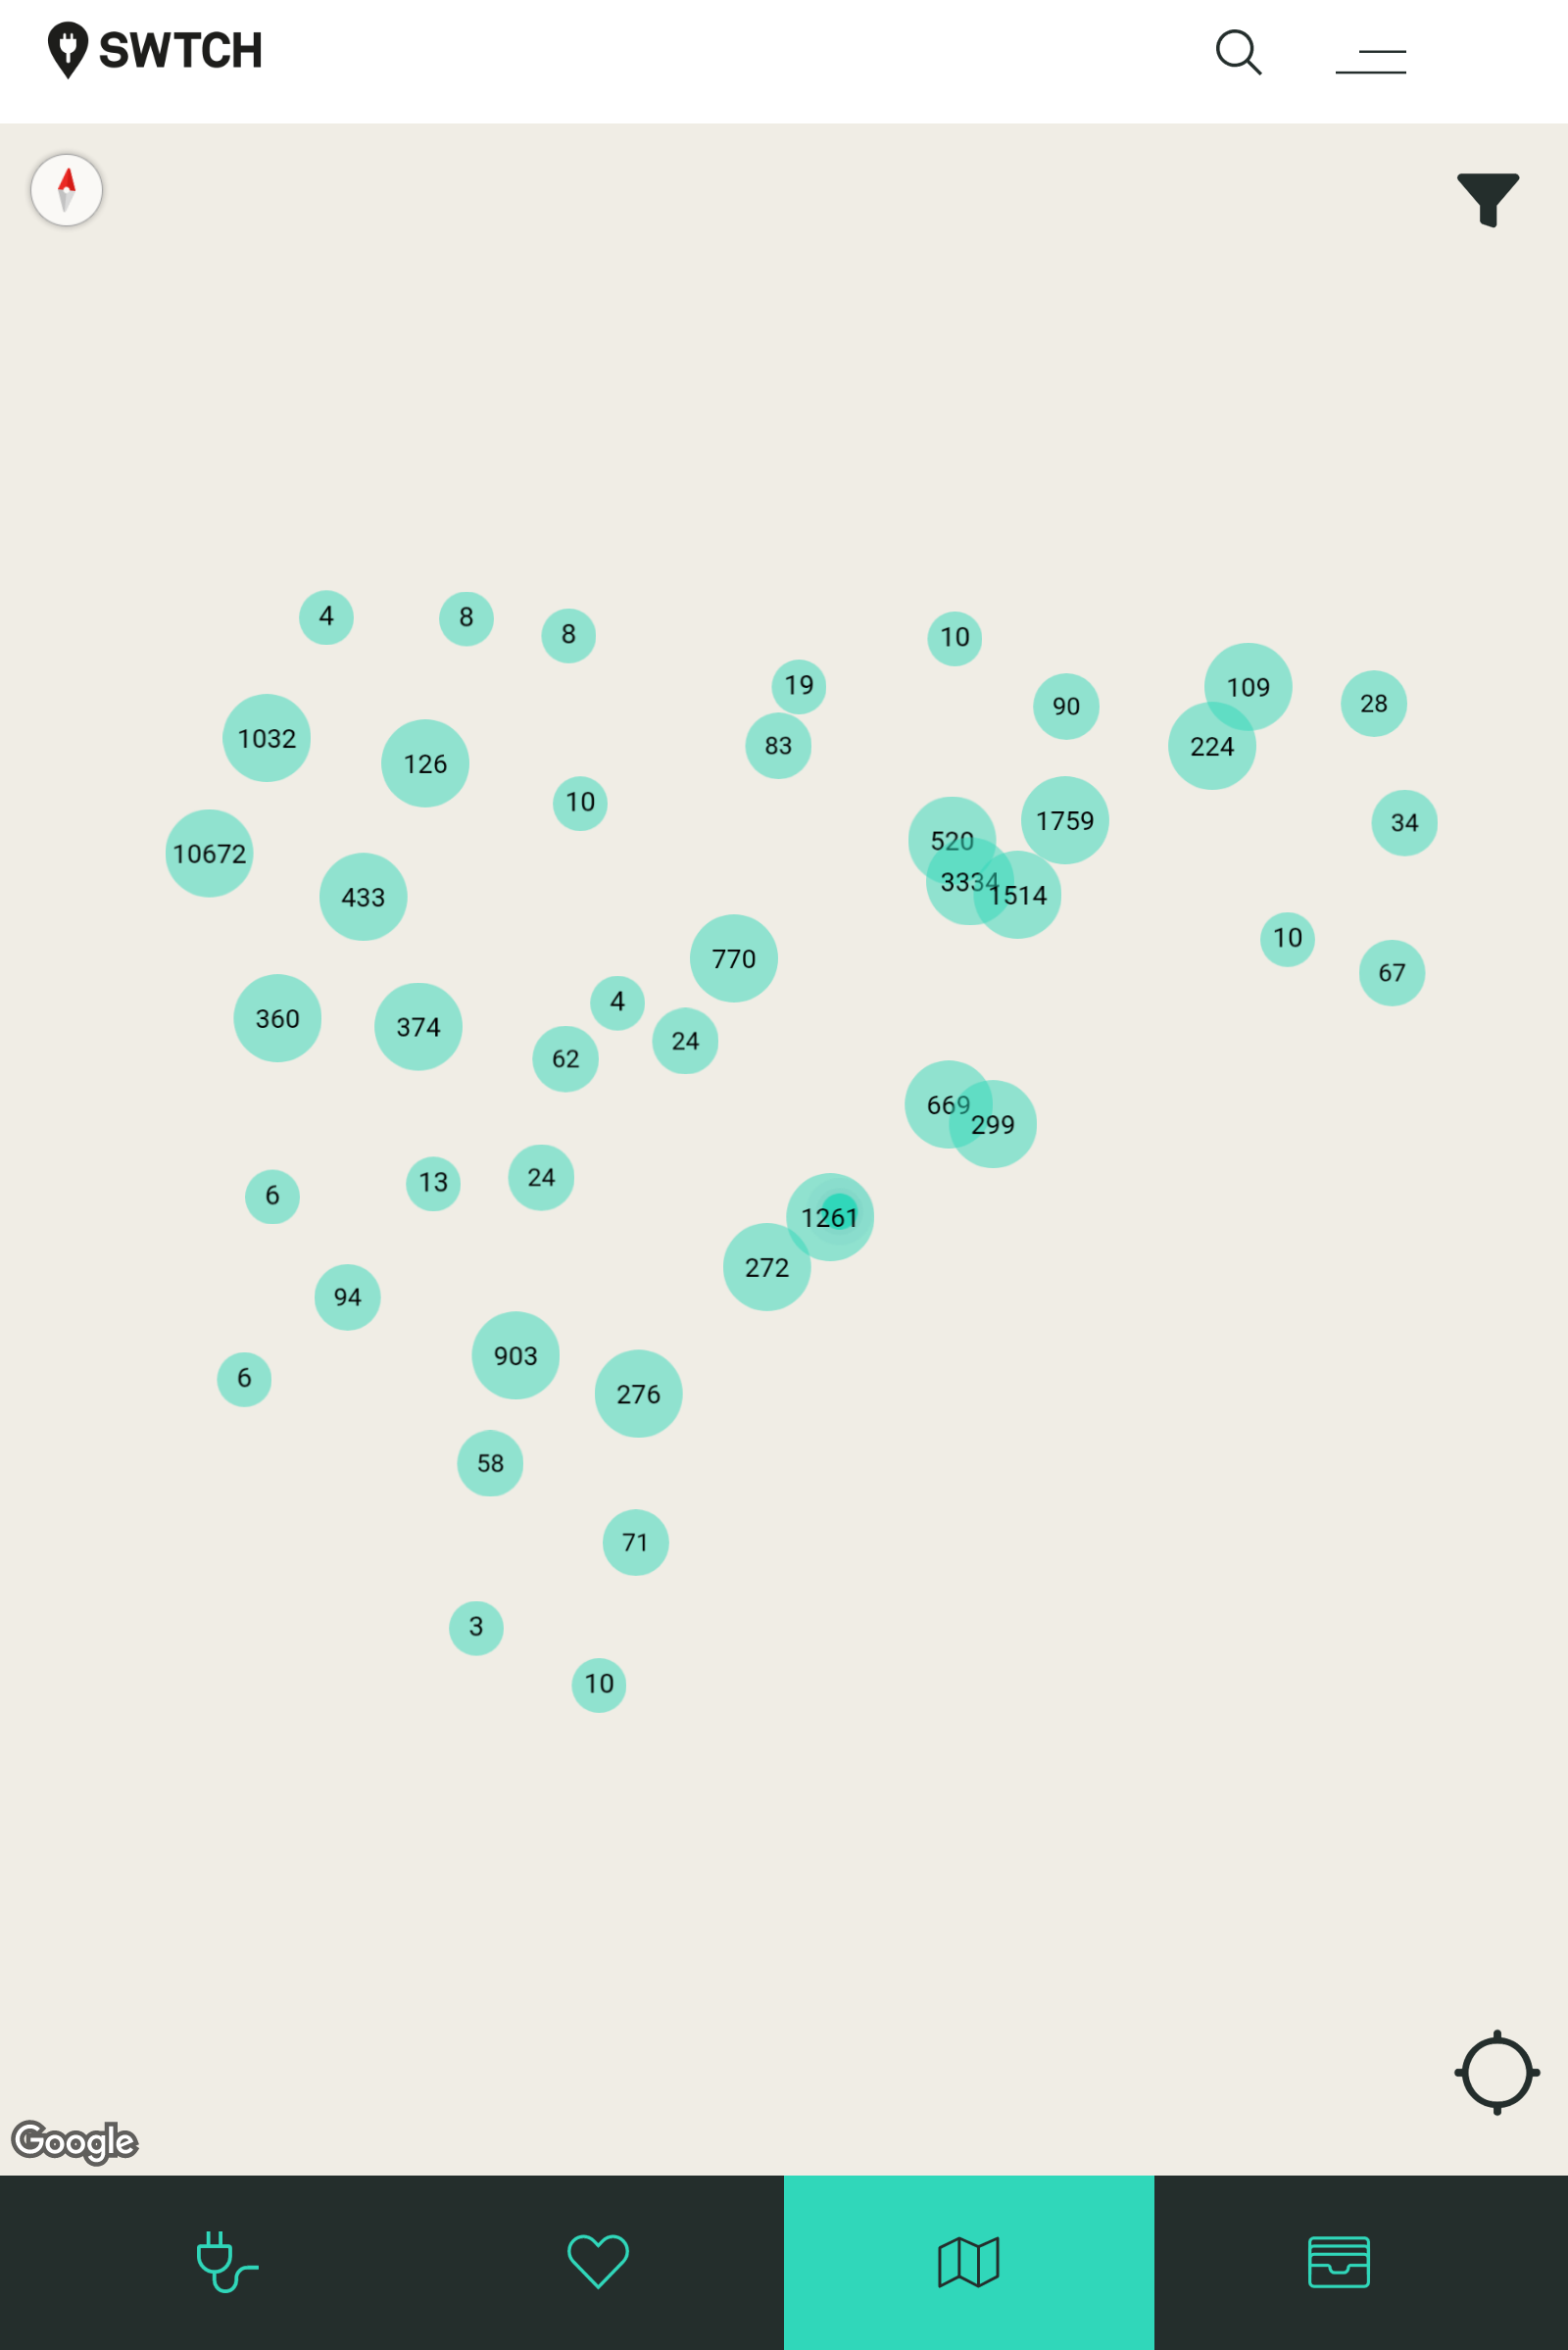
Adding EV charger details to and not seeing the SWTCH brand come up. They seem big. Are they big enough to be a brand?

Map of SWTCH stations nearby,. 4s and 6s in green circles on grey goo.
ALT text

Map of SWTCH stations nearby,. 4s and 6s in green circles on grey goo.

Map of SWTCH stations in a wide area. Big numbers in green circles on grey goo.
ALT text

Map of SWTCH stations in a wide area. Big numbers in green circles on grey goo.

Project for today: add a bunch more houses to my parents town in so I can streetcomplete them all with addresses etc. when I'm there! I really love rapid for this because it saves so much clicking.

The imagery issue, where big business is pulling all the satellite imagery is really frustrating. This is why that imagery needs to be in public hands to begin with. Rapid itself feels also like something that'll be pulled sooner rather than later. So I use it while I can.

Uiii! Selfe-made errors in OSMgo.org:

When your tool draws an "division by zero", you need to investigate. I did, while coding rendering. The cause was a way with two times the same node in sequence (not fist=last for closed ways). The distance is zero!

After inspecting an example:
The blamed way is not a way but a multi-polygon. Ways are concated. And the identical nodes at the end were the doubles %-I

And beside this: My code does not support multiple areas!

Well, there is always hope:
community.openstreetmap.org/t/

community.openstreetmap.org

All new 3D rendering ... an "OSM Building Inspector"

A) Would you like to have a detailed description how to convert the OSM 3D tagging into a VR scene? B) Would you like to have an all new software to 3D render OSM? B1) Would you like it in a new programming language with some great concepts but still annoying memory management: Zig? B2) Or would you like a stable and save language, building native, mobile and Web and not that hard to learn: Rust. C1) Would you like just an OSM Building inspector, showing the actual view directly from the OSM...

Pour ce gif je suis assez fière du travail réalisé, c'est la ville de Chongdan-up à l'ouest d'une large zone que j'ai pas mal cartographié !

openstreetmap.org/#map=16/37.9

GIF animé d'une carte OpenStreetMap, ville de Chongdan-up dans le Hwanghae du Sud, en Corée du Nord.

Première image : la principale route traversant la vile du nord-ouest au sud-est est présentes, les autres principaux axes routiers dans la ville sont cartographié avec une zone résidentielle.

Deuxième image : tous les bâtiments, toutes les écoles, le marché public, le stade, les routes résidentielles, les cours d'eau, et le landuse environnant (des champs) apparaissent, toutes les formes sont redessinés plus précisement !
ALT text

GIF animé d'une carte OpenStreetMap, ville de Chongdan-up dans le Hwanghae du Sud, en Corée du Nord. Première image : la principale route traversant la vile du nord-ouest au sud-est est présentes, les autres principaux axes routiers dans la ville sont cartographié avec une zone résidentielle. Deuxième image : tous les bâtiments, toutes les écoles, le marché public, le stade, les routes résidentielles, les cours d'eau, et le landuse environnant (des champs) apparaissent, toutes les formes sont redessinés plus précisement !

Finished micromapping Governors Island in New York a few days ago!

For anyone curious, I used a combination of Bing and NYS Orthos Online aerial imagery. The footpaths in the older areas came from a 1960’s US Department of Engineers tree survey map that had the island drawn in great detail. The rest of the information came from wikipedia articles and wikimedia + other license compatiable images. This resulted in 37,376 changes and a lot of hours of work

openstreetmap.org/#map=17/40.6

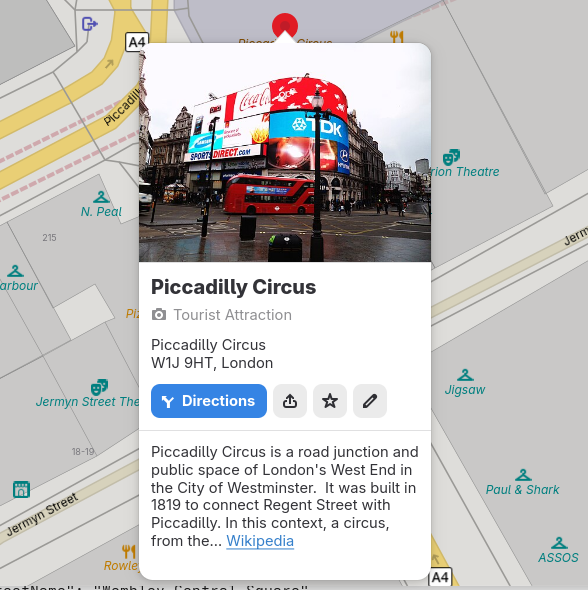
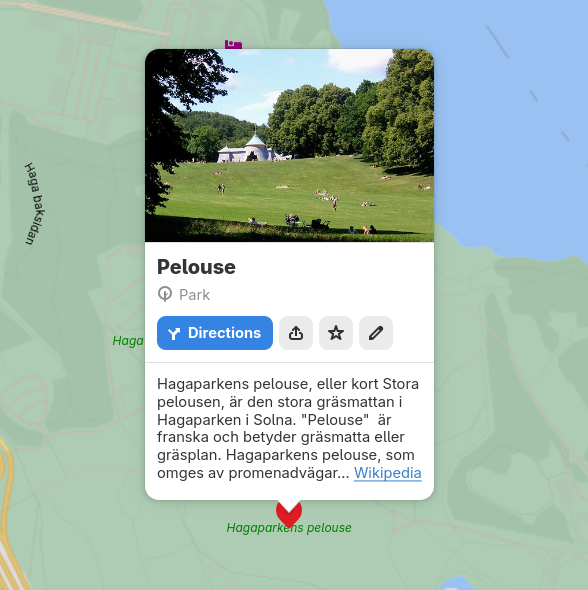
By the way, I guess the icon for "Directions" should probably be pointing to the left in regions with left-hand road traffic… 😀🛣️🧭

Showing Piccadilly Circus in London in GNOME Maps with the icon in the button for directions having the "take an exit" pointing left.
ALT text

Showing Piccadilly Circus in London in GNOME Maps with the icon in the button for directions having the "take an exit" pointing left.

Showing Hagaparken in Solna in GNOME Maps with the icon in the button for directions having the "take an exit" pointing right.
ALT text

Showing Hagaparken in Solna in GNOME Maps with the icon in the button for directions having the "take an exit" pointing right.

Petit carto à côté d'un lac et autour d'un monument.

openstreetmap.org/#map=18/38.0

GIF animé d'une carte OpenStreetMap. Zone sud du lac Kuam-ho, dans l'arrondissement de Chongdan, en Corée du Nord.

Première image : Une zone d'eau au nord, et une route au sud, rien de plus.

Deuxième image : Le barrage à l'ouest est représenté, tout le trait de côté du lac est redessiné, la zone résidentielle, les bâtiments, les routes apparaissent ! Le monument avec devant, des zones d'herbes et, derrière, la zone de bois apparaissent au sud du lac, avec la route d'accès.
ALT text

GIF animé d'une carte OpenStreetMap. Zone sud du lac Kuam-ho, dans l'arrondissement de Chongdan, en Corée du Nord. Première image : Une zone d'eau au nord, et une route au sud, rien de plus. Deuxième image : Le barrage à l'ouest est représenté, tout le trait de côté du lac est redessiné, la zone résidentielle, les bâtiments, les routes apparaissent ! Le monument avec devant, des zones d'herbes et, derrière, la zone de bois apparaissent au sud du lac, avec la route d'accès.

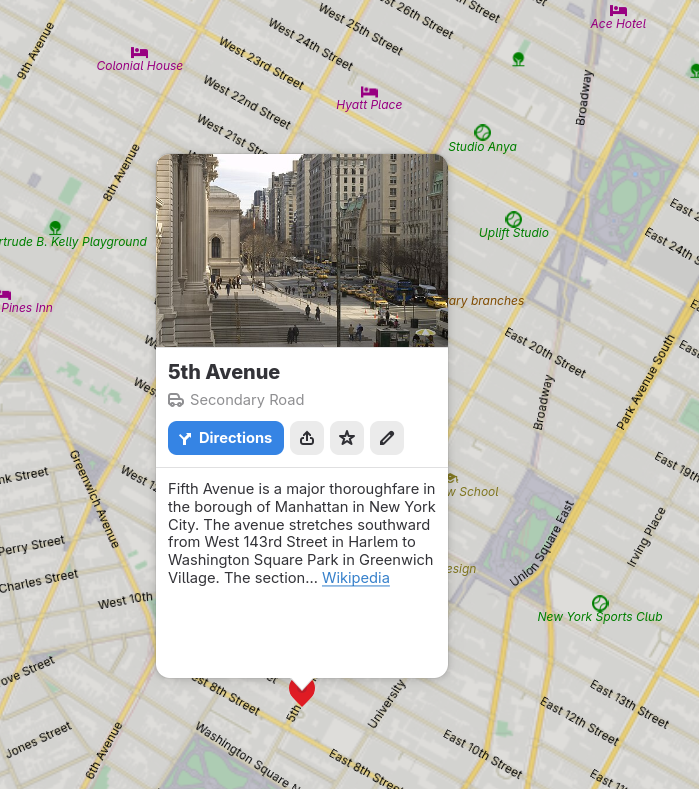
Making more things directly “clickable” in Maps, like streets…

Another idea as a follow-up on this to add functionallity to the highway shield library to be able to get a paintable object given a place' network tags. So that we could show that instead of the generic “car” icon for roads when available.

GNOME Maps showing a place info popover for 5:th Avenue in New York City.
ALT text

GNOME Maps showing a place info popover for 5:th Avenue in New York City.

GIF animé d'une carte OpenStreetMap. Village de Cheongjeong-ri, dans l'arrondissement de Chongdan, en Corée du Nord.

Première image : la route qui passe devant le village et quelques routes résidentielles sont cartographiés, avec une timide zone agricole au sud ouest, et rien d'autre.

Deuxième image : tous les bâtiments, tous les routes (chemin, routes résidentielles), des POI, une école, toutes les zones sont décrites (zones agricoles, la forêt, les vergés, les broussailles, etc...), les cours d'eau, le lac, la zone industrielle, bref tout, apparaissent !
ALT text

GIF animé d'une carte OpenStreetMap. Village de Cheongjeong-ri, dans l'arrondissement de Chongdan, en Corée du Nord. Première image : la route qui passe devant le village et quelques routes résidentielles sont cartographiés, avec une timide zone agricole au sud ouest, et rien d'autre. Deuxième image : tous les bâtiments, tous les routes (chemin, routes résidentielles), des POI, une école, toutes les zones sont décrites (zones agricoles, la forêt, les vergés, les broussailles, etc...), les cours d'eau, le lac, la zone industrielle, bref tout, apparaissent !

OpenStreetMap migrates to Debian 12: You may have seen this toot
announcing OpenStreetMap's migration to Debian on their infrastructure.

🚀 After 18 years on Ubuntu, we've upgraded the
@openstreetmap servers to Debian 12
(Bookworm). 🌍 openstreetmap.org is now faster
using Ruby 3.1. Onward to new mapping adventures! Thank you to the team for
the smooth transition.

🤓

We spoke with Grant Slater, the Senior Site Reliability Engineer for the… bits.debian.org/2024/11/openst

GIF animé d'une carte OpenStreetMap, le village de Songbuk-ri au sud de la baie de Corée, dans le Kangwon, au sud-est de la Corée du Nord, à quelques kilomètres de la frontière avec la Corée du Sud.

Première image : la principale route est présente au nord, avec quelques routes résidentielles et la ligne de chemin de fer plus au nord. La zone résidentielle est grossièrement faite. Il n'y a presque aucun bâtiment, et on remarque une petite zone de cimetière à l'ouest et de champs à l'est.

Deuxième image : tous les objets sont intégralement redessinés sauf le trait de côte au nord, soit : tous les bâtiments, toutes les routes, tous les cours d'eau. De nombreux bâtiments et zones de forêt apparaissent.
ALT text

GIF animé d'une carte OpenStreetMap, le village de Songbuk-ri au sud de la baie de Corée, dans le Kangwon, au sud-est de la Corée du Nord, à quelques kilomètres de la frontière avec la Corée du Sud. Première image : la principale route est présente au nord, avec quelques routes résidentielles et la ligne de chemin de fer plus au nord. La zone résidentielle est grossièrement faite. Il n'y a presque aucun bâtiment, et on remarque une petite zone de cimetière à l'ouest et de champs à l'est. Deuxième image : tous les objets sont intégralement redessinés sauf le trait de côte au nord, soit : tous les bâtiments, toutes les routes, tous les cours d'eau. De nombreux bâtiments et zones de forêt apparaissent.

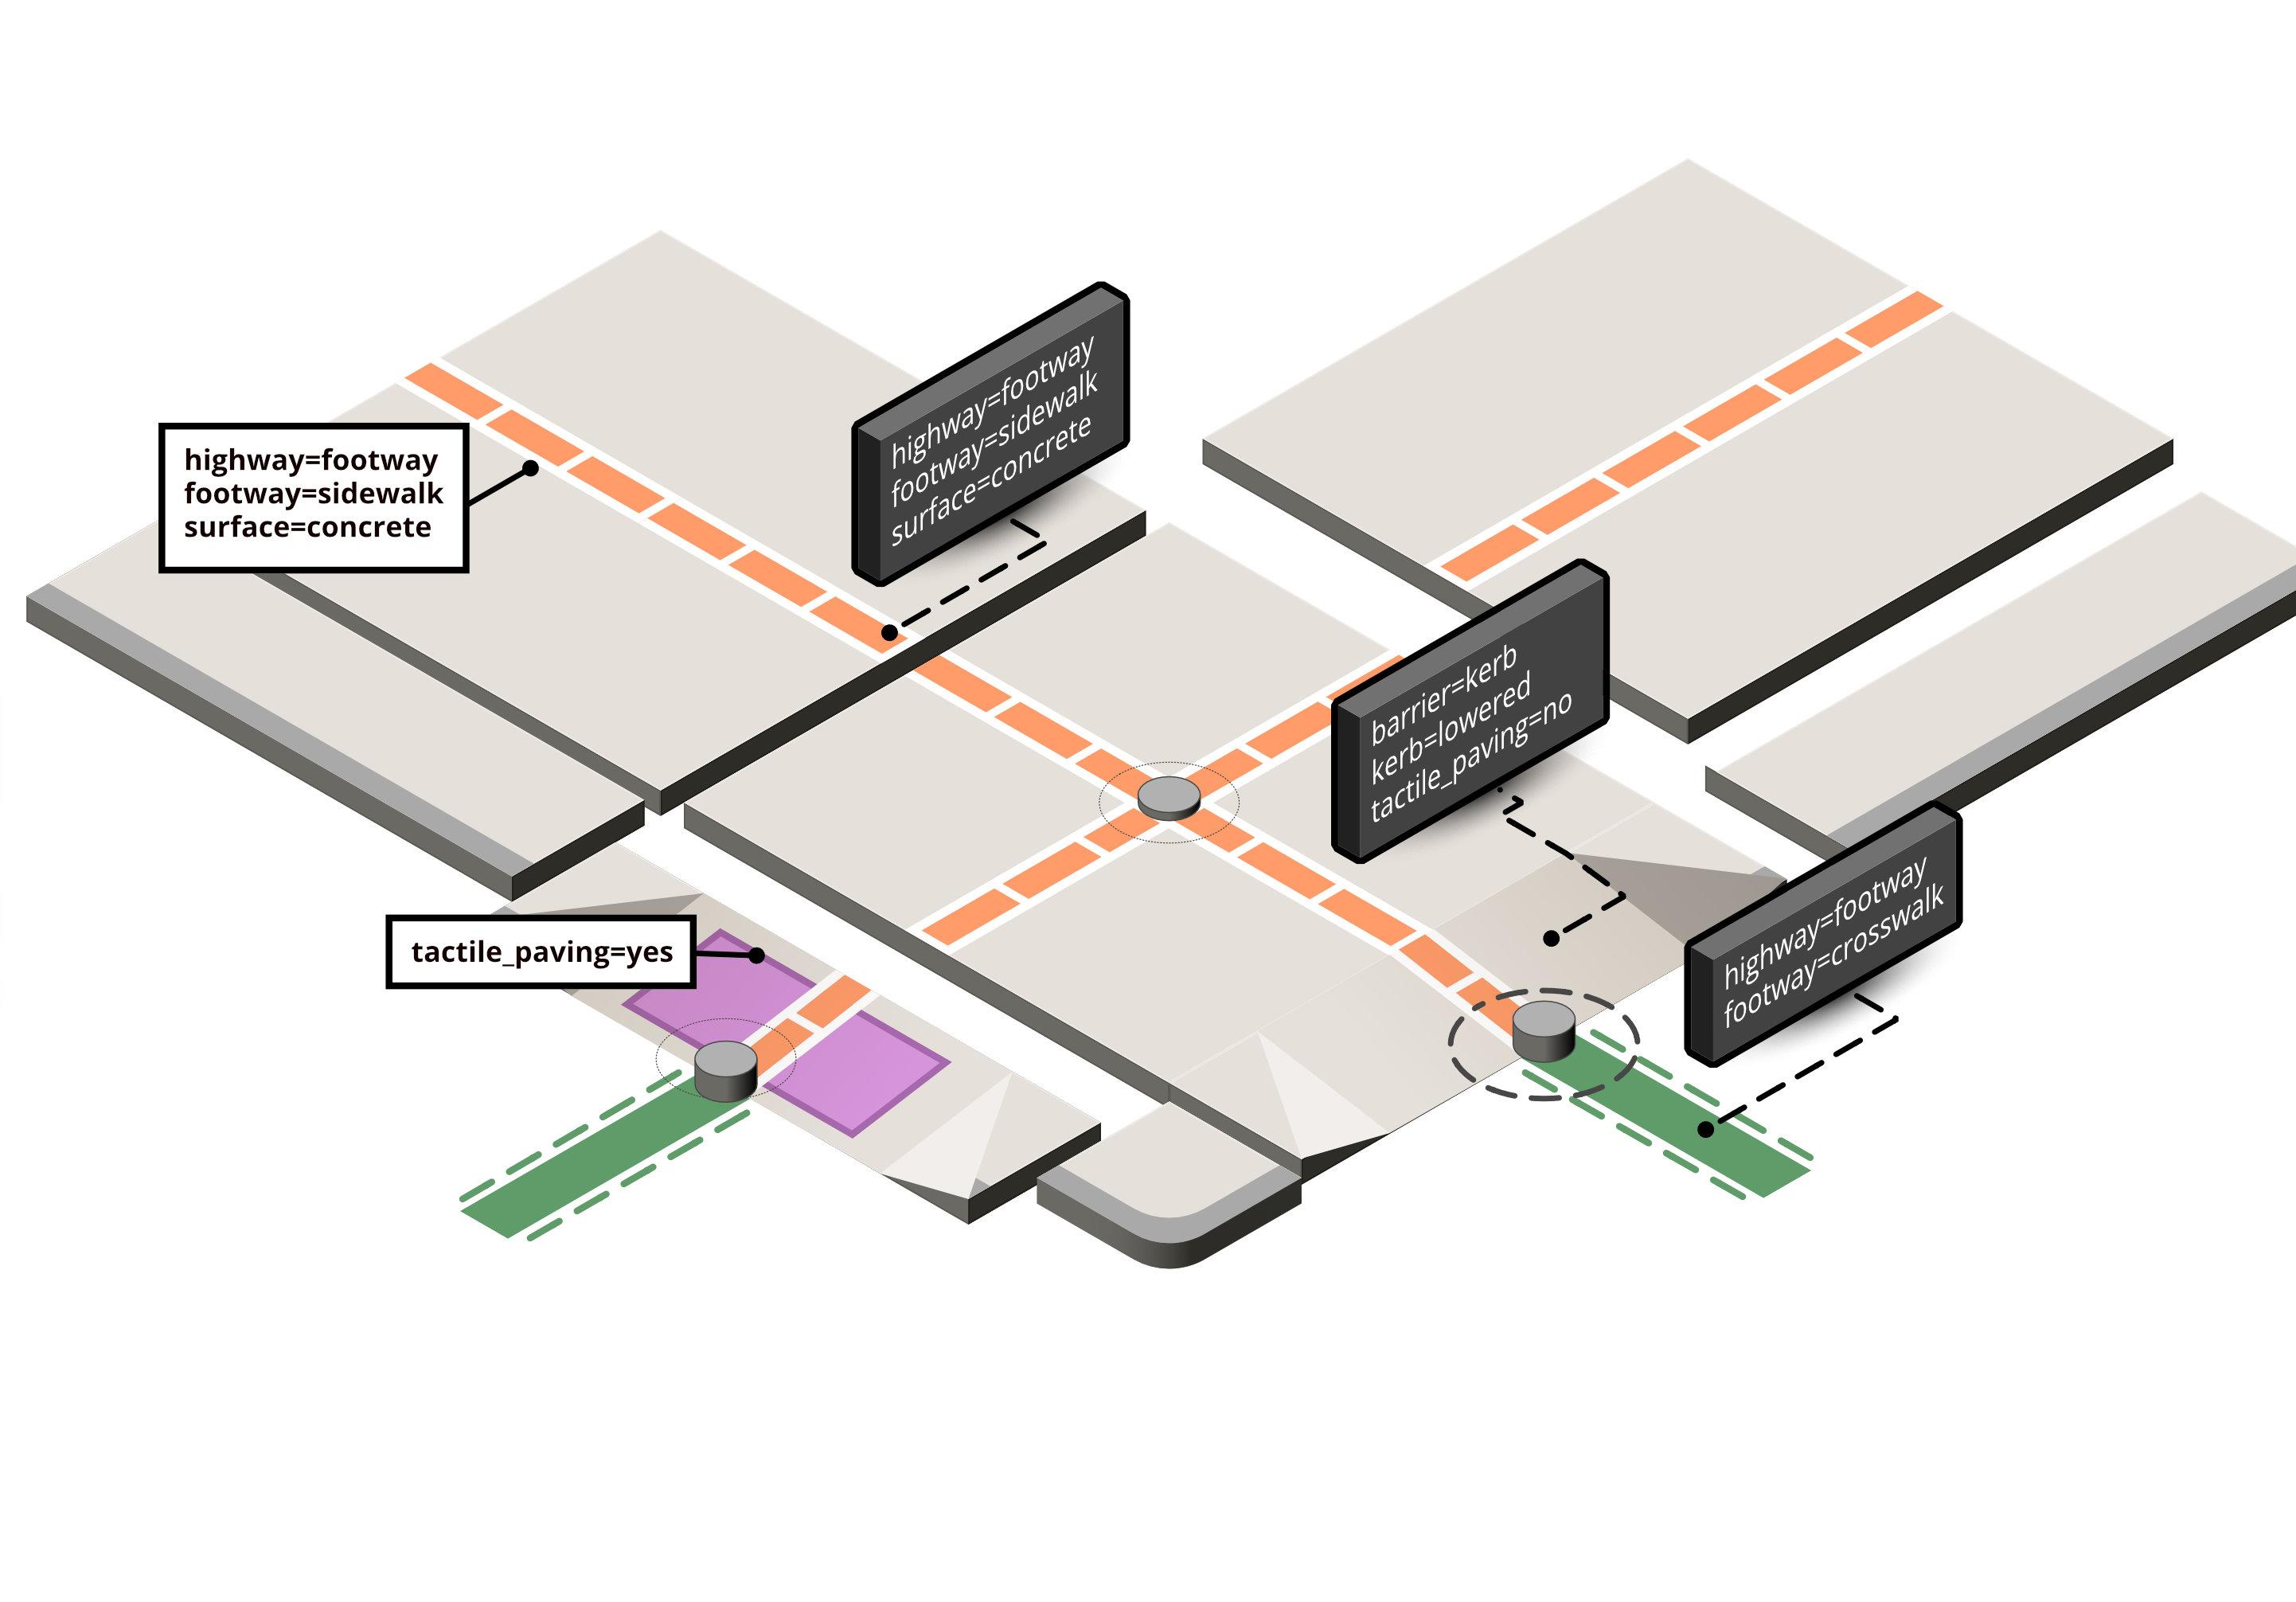
🚶‍♂️ Work in progress!

I’m exploring modular illustrations as visual aids to support contributors and documentation. The modules can be mixed and matched to visualize diverse scenarios for sidewalks, curbs, and crossings.

Early test below. Feedback welcome!

Visual concept: isometric tiles that combine to demonstrate various scenarios for mapping sidewalks, curbs, and crossings in OpenStreetMap.
ALT text

Visual concept: isometric tiles that combine to demonstrate various scenarios for mapping sidewalks, curbs, and crossings in OpenStreetMap.

GIF animé d'une carte OpenStreetMap, le village de Songbuk-ri au sud de la baie de Corée, dans le Kangwon, au sud-est de la Corée du Nord, à quelques kilomètres de la frontière avec la Corée du Sud.

Première image : la principale route est présente au nord, avec quelques routes résidentielles et la ligne de chemin de fer plus au nord. La zone résidentielle est grossièrement faite. Il n'y a presque aucun bâtiment, et on remarque une petite zone de cimetière à l'ouest et de champs à l'est.

Deuxième image : tous les objets sont intégralement redessinés sauf le trait de côte au nord, soit : tous les bâtiments, toutes les routes, tous les cours d'eau. De nombreux bâtiments et zones de forêt apparaissent.
ALT text

GIF animé d'une carte OpenStreetMap, le village de Songbuk-ri au sud de la baie de Corée, dans le Kangwon, au sud-est de la Corée du Nord, à quelques kilomètres de la frontière avec la Corée du Sud. Première image : la principale route est présente au nord, avec quelques routes résidentielles et la ligne de chemin de fer plus au nord. La zone résidentielle est grossièrement faite. Il n'y a presque aucun bâtiment, et on remarque une petite zone de cimetière à l'ouest et de champs à l'est. Deuxième image : tous les objets sont intégralement redessinés sauf le trait de côte au nord, soit : tous les bâtiments, toutes les routes, tous les cours d'eau. De nombreux bâtiments et zones de forêt apparaissent.

Cartographie dont je suis assez content. Le avant après est assez saisissant 😁. C'est dans la campagne nord-coréenne, dans le sud du pays dans l'arrondissement de Chongdan, dans et autour du village de Hongsan-ri.

openstreetmap.org/#map=15/37.9

GIF animé d'une carte OpenStreetMap. GIF avant après, dans et autour du village de Hongsan-ri, arrondissement de Chongdan, Corée du Nord

Première image : les principales routes sont présentes, avec une légère zone agricole au sud-ouest.

Deuxième image : tous les bâtiments, le POI, l'école, toutes les routes, mais surtout les landuses : toutes les zones agricoles, de bois, de verger, de mine, le lac et la zone industrielle apparaissent !
ALT text

GIF animé d'une carte OpenStreetMap. GIF avant après, dans et autour du village de Hongsan-ri, arrondissement de Chongdan, Corée du Nord Première image : les principales routes sont présentes, avec une légère zone agricole au sud-ouest. Deuxième image : tous les bâtiments, le POI, l'école, toutes les routes, mais surtout les landuses : toutes les zones agricoles, de bois, de verger, de mine, le lac et la zone industrielle apparaissent !

🚶‍♂️ Work in progress!

I’m exploring modular illustrations as visual aids to support contributors and documentation. The modules can be mixed and matched to visualize diverse scenarios for sidewalks, curbs, and crossings.

Early test below. Feedback welcome!

Visual concept: isometric tiles that combine to demonstrate various scenarios for mapping sidewalks, curbs, and crossings in OpenStreetMap.
ALT text

Visual concept: isometric tiles that combine to demonstrate various scenarios for mapping sidewalks, curbs, and crossings in OpenStreetMap.

Ajout du village de Sokdam dans la campagne nord-coréenne.

openstreetmap.org/#map=16/38.1

GIF animé d'une carte OpenStreetMap. Village de Sokdam dans l'arrondissement de Pyoksong, au sud du Hwanghae du Sud, en Corée du Nord.

Première image : La principale route allant du nord au sud, la ligne électrique allant d'ouest en est, et un bout de forêt à l'ouest sont présents.

Deuxième image : tous les bâtiments et routes, l'école, les zones résidentielles, agricoles et boisées, la ferme et les petits cours d'eau apparaissent !
ALT text

GIF animé d'une carte OpenStreetMap. Village de Sokdam dans l'arrondissement de Pyoksong, au sud du Hwanghae du Sud, en Corée du Nord. Première image : La principale route allant du nord au sud, la ligne électrique allant d'ouest en est, et un bout de forêt à l'ouest sont présents. Deuxième image : tous les bâtiments et routes, l'école, les zones résidentielles, agricoles et boisées, la ferme et les petits cours d'eau apparaissent !

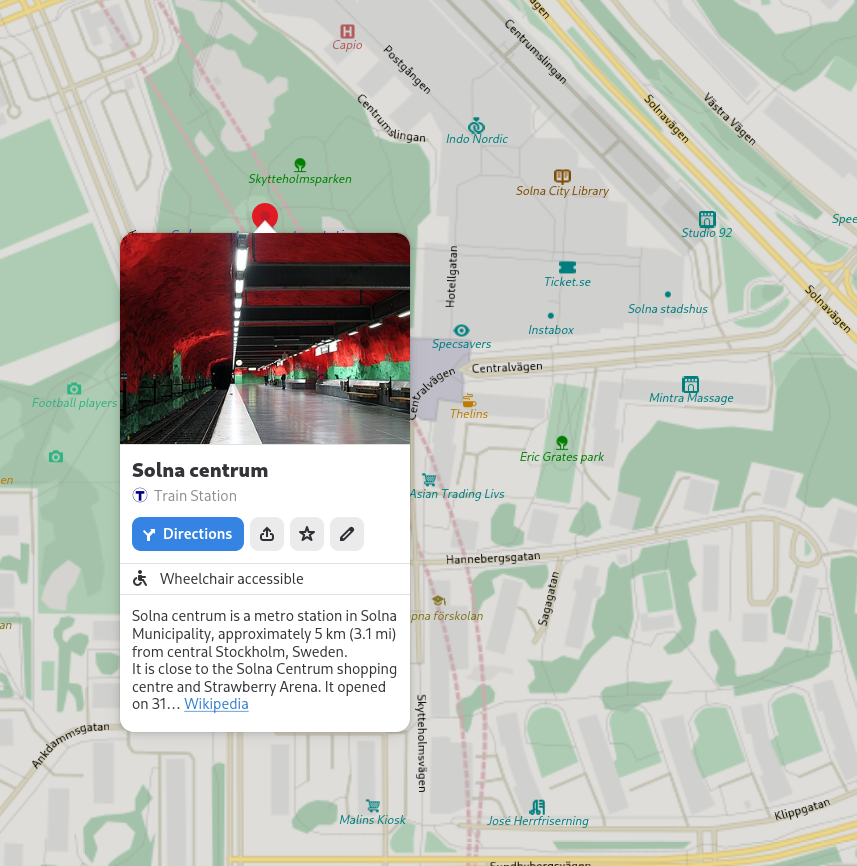
Experimenting with showing custom icons for stations. Inspired a bit from our highway shield rendered (derived from OpenStreetMap Americana)

gitlab.gnome.org/GNOME/gnome-m

It's making use of the "network:wikidata" OSM tag.

Currently rendering these icons in map view itself is not tested (this needs an extra addition to our planetiler generator for the vector tiles to be run in the next import).

Screenshot showing GNOME Maps showing a place info bubble for Solna Centrum metro station in Solna. Showing a custom network-specific icon (the iconic Stockholm “T” for “tunnelbana” symbol)
ALT text

Screenshot showing GNOME Maps showing a place info bubble for Solna Centrum metro station in Solna. Showing a custom network-specific icon (the iconic Stockholm “T” for “tunnelbana” symbol)

Ma cartographie des 7 derniers jours.

Et la dernière image c'est la vue d'ensemble de la zone amélioré. Avez-vous trouvé où le deuxième GIF se trouve ? 😜

openstreetmap.org/#map=14/41.6

GIF animé d'une carte OpenStreetMap de la ville de Potae-rodongjagu (ou Phothae-dong), au sud du Mont Paektu en Corée du Nord.

Première image : Une zone résidentielle entoure plusieurs bâtiments, le cours d'eau qui traverse la ville du nord au sud est présent, avec les principales routes et la ligne haute tension qui contourne la ville par le l'est et le nord.

Deuxième image : tous les bâtiments, la zone industrielle à l'ouest, les zones de bois, de champs, de broussailles apparaissent tout autour de la ville, toute la zone résidentielle et les routes sont redessinés !
ALT text

GIF animé d'une carte OpenStreetMap de la ville de Potae-rodongjagu (ou Phothae-dong), au sud du Mont Paektu en Corée du Nord. Première image : Une zone résidentielle entoure plusieurs bâtiments, le cours d'eau qui traverse la ville du nord au sud est présent, avec les principales routes et la ligne haute tension qui contourne la ville par le l'est et le nord. Deuxième image : tous les bâtiments, la zone industrielle à l'ouest, les zones de bois, de champs, de broussailles apparaissent tout autour de la ville, toute la zone résidentielle et les routes sont redessinés !

GIF animé d'une carte OpenStreetMap d'un village récemment construit, au sud du Mont Paektu, au sud de l'arrondissement de Samjiyon.

Première image : Il y a uniquement une route qui longe le village au sud.

Deuxième image : tous les bâtiments, un monument entouré de deux bâtiments avec une zone piétonne devant et d'une zone d'arbres derrière, une école avec son terrain de sport, les routes, les zones agricoles au nord, de broussailles au sud et de prairies tout autour, apparaissent !
ALT text

GIF animé d'une carte OpenStreetMap d'un village récemment construit, au sud du Mont Paektu, au sud de l'arrondissement de Samjiyon. Première image : Il y a uniquement une route qui longe le village au sud. Deuxième image : tous les bâtiments, un monument entouré de deux bâtiments avec une zone piétonne devant et d'une zone d'arbres derrière, une école avec son terrain de sport, les routes, les zones agricoles au nord, de broussailles au sud et de prairies tout autour, apparaissent !

GIF animé d'une carte OpenStreetMap d'un village récemment construit, au sud du Mont Paektu, au sud de l'arrondissement de Samjiyon.

Première image : Il y a une route qui longe le village au nord. Dans le village il y a des routes résidentielles, et la zone résidentielle est présente avec des bâtiments ordonnés de manière rectangulaire.

Deuxième image : La zone a été démolie puis reconstruite. Les bâtiments suivent maintenant un plan en quart de cercle. Toutes les routes résidentielles suivent ce plan. De chaque côte de la route au nord du village, une bande de forêt apparait, et derrière ces zones de forêt il y a des zones de champs. Des champs au sud, à l'est, et un peu à l'ouest entourent le village.
ALT text

GIF animé d'une carte OpenStreetMap d'un village récemment construit, au sud du Mont Paektu, au sud de l'arrondissement de Samjiyon. Première image : Il y a une route qui longe le village au nord. Dans le village il y a des routes résidentielles, et la zone résidentielle est présente avec des bâtiments ordonnés de manière rectangulaire. Deuxième image : La zone a été démolie puis reconstruite. Les bâtiments suivent maintenant un plan en quart de cercle. Toutes les routes résidentielles suivent ce plan. De chaque côte de la route au nord du village, une bande de forêt apparait, et derrière ces zones de forêt il y a des zones de champs. Des champs au sud, à l'est, et un peu à l'ouest entourent le village.

Image d'une Carte OpenStreetMap avec du recul. Carte centré sur la ville de Potae-rodongjagu. Vue d'ensemble de la zone travaillé pendant 7 jours. La carte fourmille de détail au centre, avec de nombreux détails de landuse, et elle est peu détaillé tout autour de cette zone.
ALT text

Image d'une Carte OpenStreetMap avec du recul. Carte centré sur la ville de Potae-rodongjagu. Vue d'ensemble de la zone travaillé pendant 7 jours. La carte fourmille de détail au centre, avec de nombreux détails de landuse, et elle est peu détaillé tout autour de cette zone.

yesterday Michael Montani introduced to tools to improve and skills based on the specific course about it mappers.un.org/learning

Osmose (an OpenStreetMap validation tool) is displayed on a screen during a presentation. The left side of the screen shows a list of mapping issues, including broken highways, duplicate geometry, and bad tags, marked with different colored dots indicating their severity. The right side of the screen shows a map of Nairobi, Kenya, with roads and various markers, highlighting areas needing attention.
ALT text

Osmose (an OpenStreetMap validation tool) is displayed on a screen during a presentation. The left side of the screen shows a list of mapping issues, including broken highways, duplicate geometry, and bad tags, marked with different colored dots indicating their severity. The right side of the screen shows a map of Nairobi, Kenya, with roads and various markers, highlighting areas needing attention.

Attendees seated in a lecture hall with red cushioned seats. Michael Montani, the presenter, is not visible, but participants are engaged, some using laptops while others listen. The room is sparsely filled, and a whiteboard is visible at the back of the room. The atmosphere suggests focused attention during a presentation.
ALT text

Attendees seated in a lecture hall with red cushioned seats. Michael Montani, the presenter, is not visible, but participants are engaged, some using laptops while others listen. The room is sparsely filled, and a whiteboard is visible at the back of the room. The atmosphere suggests focused attention during a presentation.

yesterday Anastazia Caroll told her journey as a , how she went beyond her fears of not being technical enough to embrace and and how she enjoyed to improve her skills and being able to deliver strong products now

Anastazia Caroll is standing at a podium, delivering a presentation. She is wearing glasses and a lanyard, speaking into a microphone. Behind her, part of a slide is projected on the screen, featuring colorful upward-pointing arrows and the text, "Direct Contribution in Projects and Creating Fieldwork Flow."
ALT text

Anastazia Caroll is standing at a podium, delivering a presentation. She is wearing glasses and a lanyard, speaking into a microphone. Behind her, part of a slide is projected on the screen, featuring colorful upward-pointing arrows and the text, "Direct Contribution in Projects and Creating Fieldwork Flow."

A slide projected on a screen titled "Milestone" features three key points: "Personal Growth," "Direct Contribution in Projects and Creating Fieldwork Flow," and "Networking and Community Engagement." The slide has a playful design with colorful shapes and a cartoon figure climbing up red and blue arrows, symbolizing progress and achievement.
ALT text

A slide projected on a screen titled "Milestone" features three key points: "Personal Growth," "Direct Contribution in Projects and Creating Fieldwork Flow," and "Networking and Community Engagement." The slide has a playful design with colorful shapes and a cartoon figure climbing up red and blue arrows, symbolizing progress and achievement.

yesterday Yvonne Darko told how she organized a street views collection in her village to map pharmacies and addresses in . I like she used to host the pictures

A presentation slide titled "Methodology" outlines steps taken by Yvonne Darko in her street views collection project. The slide lists actions like taking images, using metadata to map on OSM, filling in house numbers and street names, saving images on Wikimedia Commons, and using an open license. A large Wikimedia Commons logo is displayed on the right. A small image of Yvonne Darko speaking is visible in the bottom-right corner of the slide.
ALT text

A presentation slide titled "Methodology" outlines steps taken by Yvonne Darko in her street views collection project. The slide lists actions like taking images, using metadata to map on OSM, filling in house numbers and street names, saving images on Wikimedia Commons, and using an open license. A large Wikimedia Commons logo is displayed on the right. A small image of Yvonne Darko speaking is visible in the bottom-right corner of the slide.

thanks to the local technical team broadcasting the event from to the remote !

A shot from the back of the auditorium showing the stage, with a speaker presenting on a large screen that reads “General Meetings, including elections.” The camera on a tripod in the foreground is capturing the event for a live broadcast. The auditorium's red seats are arranged in rows leading down to the stage, with attendees scattered throughout. The venue is the "Chandaria Centre for Performing Arts," as indicated by the signage on the wall.
ALT text

A shot from the back of the auditorium showing the stage, with a speaker presenting on a large screen that reads “General Meetings, including elections.” The camera on a tripod in the foreground is capturing the event for a live broadcast. The auditorium's red seats are arranged in rows leading down to the stage, with attendees scattered throughout. The venue is the "Chandaria Centre for Performing Arts," as indicated by the signage on the wall.

A group of four men sitting at a technical desk in an auditorium, each working on laptops and screens. Several monitors display the broadcast of the event onstage. One of the men smiles at the camera, flashing a peace sign. Behind them are rows of empty red seats, as they work from the control area of the venue.
ALT text

A group of four men sitting at a technical desk in an auditorium, each working on laptops and screens. Several monitors display the broadcast of the event onstage. One of the men smiles at the camera, flashing a peace sign. Behind them are rows of empty red seats, as they work from the control area of the venue.

A camera set up on a tripod in the auditorium, positioned to capture the event happening onstage. In the background, a few attendees are seated, and the walls feature wood paneling with a sleek, modern design. Some people in the audience are focused on their phones.
ALT text

A camera set up on a tripod in the auditorium, positioned to capture the event happening onstage. In the background, a few attendees are seated, and the walls feature wood paneling with a sleek, modern design. Some people in the audience are focused on their phones.

Mateusz Konieczny presenting all what the does to support without controlling the and its vibrant

Mateusz Konieczny stands at a podium, holding a microphone during his presentation at State of the Map 2024. He is wearing a light gray shirt with a blue lanyard, speaking in front of a projected slide that lists various ways the OpenStreetMap Foundation (OSMF) supports the community, including official OSM forums, mailing lists, and fundraising. The background includes colorful geometric designs and a modern projector setup.
ALT text

Mateusz Konieczny stands at a podium, holding a microphone during his presentation at State of the Map 2024. He is wearing a light gray shirt with a blue lanyard, speaking in front of a projected slide that lists various ways the OpenStreetMap Foundation (OSMF) supports the community, including official OSM forums, mailing lists, and fundraising. The background includes colorful geometric designs and a modern projector setup.

Mateusz Konieczny continues his presentation on stage, with a slide behind him reading, "Dooacracy: OSMF is not some company where board members have legions of staff following their orders." He stands in front of a podium, addressing the audience, with a map of Kenya in the background, decorated with dots and colorful geometric shapes. The stage setup includes chairs and a projector.
ALT text

Mateusz Konieczny continues his presentation on stage, with a slide behind him reading, "Dooacracy: OSMF is not some company where board members have legions of staff following their orders." He stands in front of a podium, addressing the audience, with a map of Kenya in the background, decorated with dots and colorful geometric shapes. The stage setup includes chairs and a projector.

Stefan Keller presenting ongoing research on in introducing created by Claudio Bertozzi and an improved forked version of

A slide from Stefan Keller's presentation at State of the Map 2024 titled "Catching OSM Up with External Data with a Workflow and Tools for Conflation and Validation." The slide outlines the motivation for the talk, focusing on enhancing OpenStreetMap (OSM) through conflation and validation, showcasing interesting OSM activities, and introducing tools like OSM Conflator and DiffedPlaces. The slide includes an overview of the topics covered and a small portrait of Stefan Keller.
ALT text

A slide from Stefan Keller's presentation at State of the Map 2024 titled "Catching OSM Up with External Data with a Workflow and Tools for Conflation and Validation." The slide outlines the motivation for the talk, focusing on enhancing OpenStreetMap (OSM) through conflation and validation, showcasing interesting OSM activities, and introducing tools like OSM Conflator and DiffedPlaces. The slide includes an overview of the topics covered and a small portrait of Stefan Keller.

A slide titled "Conflation in OSM: A general workflow," providing a step-by-step guide to the conflation process. Steps include discussing the import, mapping external data to OSM schema, validating data, calculating differences, and performing the import using tools like JOSM. The slide includes a portrait of Stefan Keller in the bottom right.
ALT text

A slide titled "Conflation in OSM: A general workflow," providing a step-by-step guide to the conflation process. Steps include discussing the import, mapping external data to OSM schema, validating data, calculating differences, and performing the import using tools like JOSM. The slide includes a portrait of Stefan Keller in the bottom right.

A slide discussing "DiffedPlaces," a work-in-progress tool created as part of a master's thesis in data science by Claudio Bertozzi. The slide outlines the goals of DiffedPlaces, including implementing map matching algorithms with machine learning, calculating diffs for OSM data, and showcasing these diffs as GeoJSON on a public website. The slide includes a portrait of Stefan Keller.
ALT text

A slide discussing "DiffedPlaces," a work-in-progress tool created as part of a master's thesis in data science by Claudio Bertozzi. The slide outlines the goals of DiffedPlaces, including implementing map matching algorithms with machine learning, calculating diffs for OSM data, and showcasing these diffs as GeoJSON on a public website. The slide includes a portrait of Stefan Keller.

A slide titled "OSM Conflator: The data flow (and workflow)" depicting a flowchart illustrating the process of matching external data to OSM using the OSM Conflator tool. The diagram shows the steps involved, from data matching to validation and upload to OSM. The slide includes a small portrait of Stefan Keller.
ALT text

A slide titled "OSM Conflator: The data flow (and workflow)" depicting a flowchart illustrating the process of matching external data to OSM using the OSM Conflator tool. The diagram shows the steps involved, from data matching to validation and upload to OSM. The slide includes a small portrait of Stefan Keller.

social event at Bao Box

A wide-angle view of the Bao Box social event during State of the Map 2024. Attendees are seated at long wooden tables, socializing and enjoying their meals. The venue has a warm ambiance with string lights overhead, and there is an area for games in the background where people are playing.
ALT text

A wide-angle view of the Bao Box social event during State of the Map 2024. Attendees are seated at long wooden tables, socializing and enjoying their meals. The venue has a warm ambiance with string lights overhead, and there is an area for games in the background where people are playing.

A close-up of the Bao Box venue sign. The sign reads "Bao Box: Eat. Play. Socialize." against a black background, with illustrations of table games like ping pong and darts.
ALT text

A close-up of the Bao Box venue sign. The sign reads "Bao Box: Eat. Play. Socialize." against a black background, with illustrations of table games like ping pong and darts.

A neon sign reading "Welcome to the Jungle" hanging over an archway decorated with greenery. Several attendees are seen walking through the doorway, entering the main area of the venue for the social event. The setting is casual and inviting, with warm lighting.
ALT text

A neon sign reading "Welcome to the Jungle" hanging over an archway decorated with greenery. Several attendees are seen walking through the doorway, entering the main area of the venue for the social event. The setting is casual and inviting, with warm lighting.

Alex Hoferek presents about editors with a mixing numbers of editing, variety of used techniques, involvement and . Part of answers unfortunately controlled or blocked by managers. But in short, the more these CEs engage with the community, the more they are happy!

A presentation slide titled "Investigating Corporate Editors in OpenStreetMap" from the OSM Science Track at State of the Map 2024, taking place on September 8th. The slide indicates a video presentation with the presenter's face appearing in a small bubble on the lower right corner, showing Alex Hoferek joining the session remotely.
ALT text

A presentation slide titled "Investigating Corporate Editors in OpenStreetMap" from the OSM Science Track at State of the Map 2024, taking place on September 8th. The slide indicates a video presentation with the presenter's face appearing in a small bubble on the lower right corner, showing Alex Hoferek joining the session remotely.

A slide titled "Typology," explaining the categorization of corporate editors (CEs) based on their editing habits and job satisfaction. Four pairs of types are listed: Heavy and Light CEs, Technical and Sporadic CEs, Social and Less social CEs, and Happy and Dissatisfied CEs. The slide describes how participants were sorted into these categories, with a table showing the related measures and number of participants.
ALT text

A slide titled "Typology," explaining the categorization of corporate editors (CEs) based on their editing habits and job satisfaction. Four pairs of types are listed: Heavy and Light CEs, Technical and Sporadic CEs, Social and Less social CEs, and Happy and Dissatisfied CEs. The slide describes how participants were sorted into these categories, with a table showing the related measures and number of participants.

A slide titled "Community Ties with Satisfaction," showing that most social CEs also fall into the happy CE category. The slide explains how social and happy CEs come from varied employment backgrounds, but many were OpenStreetMap users before they were employed. Conversely, less social and dissatisfied editors were homogenous in their work style, typically full-time, paid hourly, and based in North America.
ALT text

A slide titled "Community Ties with Satisfaction," showing that most social CEs also fall into the happy CE category. The slide explains how social and happy CEs come from varied employment backgrounds, but many were OpenStreetMap users before they were employed. Conversely, less social and dissatisfied editors were homogenous in their work style, typically full-time, paid hourly, and based in North America.

A slide titled "Discussion" summarizing the study's findings. It notes that 39 complete and 5 partial responses were collected. Over half of the corporate editors' population was unavailable for the study due to managerial control. One corporation even redirected all communication to the managers' inbox. The slide concludes that while the study doesn't fully represent corporate editors, it opens the discussion about their role in OSM. Alex Hoferek's video feed is visible in the corner of the slide.
ALT text

A slide titled "Discussion" summarizing the study's findings. It notes that 39 complete and 5 partial responses were collected. Over half of the corporate editors' population was unavailable for the study due to managerial control. One corporation even redirected all communication to the managers' inbox. The slide concludes that while the study doesn't fully represent corporate editors, it opens the discussion about their role in OSM. Alex Hoferek's video feed is visible in the corner of the slide.

OpenStreetMap migrates to Debian 12: You may have seen this toot
announcing OpenStreetMap's migration to Debian on their infrastructure.

🚀 After 18 years on Ubuntu, we've upgraded the
@openstreetmap servers to Debian 12
(Bookworm). 🌍 openstreetmap.org is now faster
using Ruby 3.1. Onward to new mapping adventures! Thank you to the team for
the smooth transition.

🤓

We spoke with Grant Slater, the Senior Site Reliability Engineer for the… bits.debian.org/2024/11/openst

13 years ago I mapped hiking paths near by relative's village. Every path because was empty in the area except main (car) roads. Today I noticed the village has a new information board of suggested hiking routes. The map: "copyright OpenStreetMap contributors". Made me a bit proud.

Went back to Henderson to finalize the updates. I think i updated all i could with out starting to assume details. Also some mappers suggested straightening out the roads, so i did that across the entire town.

openstreetmap.org/#map=16/40.7

Included are the original before photo, and the final after.

As a side note, bing was working on JOSM for a minute and then stopped again.

Henderson Before
ALT text

Henderson Before

Henderson After
ALT text

Henderson After

I love and I love but I do not understand what the strategy is here:

blog.mozilla.ai/map-features-i

It reads like looking for problems to apply AI to for "thought leadership" — and some ten years late at that.

OpenStreetMap has many players using machine learning; from big players to open source pipelines and models. It's not a technical problem to solve.

What are you doing Mozilla? Have you talked to anyone in the OpenStreetMap community?

Mozilla.AI Map Features in OpenStreetMap with Computer Vision
ALT text

Mozilla.AI Map Features in OpenStreetMap with Computer Vision

Pour la Journée Mondiale de l'Eau ce samedi 22 mars, je vous ai concocté quelques requêtes Overpass sympathiques qui valorisent les données hydrographiques présentes dans .

Légende des visuels :
➡️ Rivières d'une commune
➡️ Cours d'eau en amont d'un point
➡️ Communes d'un bassin versant
➡️ De la source à l'Océan, avec les plans d'eau traversés et les zones humides adjacentes

Les requêtes et quelques explications sont dans cet article : osm.org/user/Carto'Cit%C3%A9/d

Just rolled the stable releases for GNOME 48
GNOME Maps 48: download.gnome.org/sources/gno
libshumate 1.4.0: download.gnome.org/sources/lib

And also 47.5 for Maps with a cherry-pick for the update to use Transitous for public transit routing in Finland (due to Digitransit sunsetting the old OpenTripPlanner 1.x API in April).

And now rest and fika for the rest of the day 😀

download.gnome.org

Index of /sources/libshumate/1.4/

Went back to Henderson to finalize the updates. I think i updated all i could with out starting to assume details. Also some mappers suggested straightening out the roads, so i did that across the entire town.

openstreetmap.org/#map=16/40.7

Included are the original before photo, and the final after.

As a side note, bing was working on JOSM for a minute and then stopped again.

Henderson Before
ALT text

Henderson Before

Henderson After
ALT text

Henderson After

(l'était temps !😀)
Ici depuis 2020, vous trouverez là beaucoup de repouets et de contenu autour d'OpenStreetMap🌍, Panoramax📷 (GoPro Max) et la cartographie🗺️ en général.
Je suis aussi utilisateur heureux de l'anneau contraceptif ⭕Andro-switch et promeut son usage et sa certification (➡️ coopérative Entrelac).

J'aime tout l'internet qui bidouille et j'ai une passion honteuse pour les YouTube Poop🤪 .

Hmmm, looks like my old was a bit out of date.

I'm Davie Dean. I'm proudly , and . On here my pronouns are she/her, but I also enjoy being David and he/him a lot of time time elsewhere. :transgender_flag: :enby: :flag_bigender:

In non stuff, I'm a data enthusiast with a passion for and a volunteer. These days I'm getting deep into and , particular in the area of danger.

Proudly based on and lands in , .

Davie, wearing a yellow short sleeved top, a navy broderie skirt, purple boots and with a brown cross body bag. Standing in front of a hand rail on the Neville Bonner Bridge with Meanjin/Brisbane and the river in the background.
ALT text

Davie, wearing a yellow short sleeved top, a navy broderie skirt, purple boots and with a brown cross body bag. Standing in front of a hand rail on the Neville Bonner Bridge with Meanjin/Brisbane and the river in the background.

13 years ago I mapped hiking paths near by relative's village. Every path because was empty in the area except main (car) roads. Today I noticed the village has a new information board of suggested hiking routes. The map: "copyright OpenStreetMap contributors". Made me a bit proud.

2024 YOUTHMAPPERS UFRJ PRODUCTION

Our YouthMappers chapter celebrated its first anniversary in May 2024 and we're still going strong, with open training activities and mapping projects with the lovelly .

This year, we incorporated uMap (FR) into the basic OSM course in order to offer more resources to those who follow us. Only in 2024, there were 17 training sessions (Short courses) and 700 certificates were issued.

ivides.org/youthmappers-ufrj

🇧🇷🌎

I wonder why @openstreetmap 'Find directions between two points' function do not have the option for public transport routes?

Moreover, when at least Valhalla seems to include them (mapzen.com/products/mobility/t, through transitland) (, and maybe GraphHopper [graphhopper.com] too?)

I found this question here too:
reddit.com/r/openstreetmap/com

And not only OsmAnd @organicmaps and Transportr (through navitia.io/) include this function, but the other resources seem very powerful, particulartly transitland (transit.land), travic/Movility Portal by geOps (mobility.portal.geops.io), mapset (mapset.io/en), and the Public Transport Enabler (github.com/schildbach/public-t, gitlab.com/oeffi/public-transp) and Oeffi (gitlab.com/oeffi/oeffi)

gitlab.com

Öffi / oeffi · GitLab

Öffi – The King of Public Transit! Community: https://matrix.to/#/#oeffi:schildbach.de – Binary: https://f-droid.org/packages/de.schildbach.oeffi/

OpenStreetMap migrates to Debian 12: You may have seen this toot
announcing OpenStreetMap's migration to Debian on their infrastructure.

🚀 After 18 years on Ubuntu, we've upgraded the
@openstreetmap servers to Debian 12
(Bookworm). 🌍 openstreetmap.org is now faster
using Ruby 3.1. Onward to new mapping adventures! Thank you to the team for
the smooth transition.

🤓

We spoke with Grant Slater, the Senior Site Reliability Engineer for the… bits.debian.org/2024/11/openst

Over the past few months, I played around with OpenStreetMap a lot so as to learn some Blender basics. As there was a lack of a comprehensive guide out there on the Internet, I published something for the first time in ages.

"Importing OpenStreetMap data into Blender using JOSM and OSM2World"

n0toose.net/posts/osm-to-blend

n0toose.net

Importing OpenStreetMap data into Blender using JOSM and OSM2World · n0toose

Taking crowdsourced map data to a whole new dimension.

Alex Hoferek presents about editors with a mixing numbers of editing, variety of used techniques, involvement and . Part of answers unfortunately controlled or blocked by managers. But in short, the more these CEs engage with the community, the more they are happy!

A presentation slide titled "Investigating Corporate Editors in OpenStreetMap" from the OSM Science Track at State of the Map 2024, taking place on September 8th. The slide indicates a video presentation with the presenter's face appearing in a small bubble on the lower right corner, showing Alex Hoferek joining the session remotely.
ALT text

A presentation slide titled "Investigating Corporate Editors in OpenStreetMap" from the OSM Science Track at State of the Map 2024, taking place on September 8th. The slide indicates a video presentation with the presenter's face appearing in a small bubble on the lower right corner, showing Alex Hoferek joining the session remotely.

A slide titled "Typology," explaining the categorization of corporate editors (CEs) based on their editing habits and job satisfaction. Four pairs of types are listed: Heavy and Light CEs, Technical and Sporadic CEs, Social and Less social CEs, and Happy and Dissatisfied CEs. The slide describes how participants were sorted into these categories, with a table showing the related measures and number of participants.
ALT text

A slide titled "Typology," explaining the categorization of corporate editors (CEs) based on their editing habits and job satisfaction. Four pairs of types are listed: Heavy and Light CEs, Technical and Sporadic CEs, Social and Less social CEs, and Happy and Dissatisfied CEs. The slide describes how participants were sorted into these categories, with a table showing the related measures and number of participants.

A slide titled "Community Ties with Satisfaction," showing that most social CEs also fall into the happy CE category. The slide explains how social and happy CEs come from varied employment backgrounds, but many were OpenStreetMap users before they were employed. Conversely, less social and dissatisfied editors were homogenous in their work style, typically full-time, paid hourly, and based in North America.
ALT text

A slide titled "Community Ties with Satisfaction," showing that most social CEs also fall into the happy CE category. The slide explains how social and happy CEs come from varied employment backgrounds, but many were OpenStreetMap users before they were employed. Conversely, less social and dissatisfied editors were homogenous in their work style, typically full-time, paid hourly, and based in North America.

A slide titled "Discussion" summarizing the study's findings. It notes that 39 complete and 5 partial responses were collected. Over half of the corporate editors' population was unavailable for the study due to managerial control. One corporation even redirected all communication to the managers' inbox. The slide concludes that while the study doesn't fully represent corporate editors, it opens the discussion about their role in OSM. Alex Hoferek's video feed is visible in the corner of the slide.
ALT text

A slide titled "Discussion" summarizing the study's findings. It notes that 39 complete and 5 partial responses were collected. Over half of the corporate editors' population was unavailable for the study due to managerial control. One corporation even redirected all communication to the managers' inbox. The slide concludes that while the study doesn't fully represent corporate editors, it opens the discussion about their role in OSM. Alex Hoferek's video feed is visible in the corner of the slide.

social event at Bao Box

A wide-angle view of the Bao Box social event during State of the Map 2024. Attendees are seated at long wooden tables, socializing and enjoying their meals. The venue has a warm ambiance with string lights overhead, and there is an area for games in the background where people are playing.
ALT text

A wide-angle view of the Bao Box social event during State of the Map 2024. Attendees are seated at long wooden tables, socializing and enjoying their meals. The venue has a warm ambiance with string lights overhead, and there is an area for games in the background where people are playing.

A close-up of the Bao Box venue sign. The sign reads "Bao Box: Eat. Play. Socialize." against a black background, with illustrations of table games like ping pong and darts.
ALT text

A close-up of the Bao Box venue sign. The sign reads "Bao Box: Eat. Play. Socialize." against a black background, with illustrations of table games like ping pong and darts.

A neon sign reading "Welcome to the Jungle" hanging over an archway decorated with greenery. Several attendees are seen walking through the doorway, entering the main area of the venue for the social event. The setting is casual and inviting, with warm lighting.
ALT text

A neon sign reading "Welcome to the Jungle" hanging over an archway decorated with greenery. Several attendees are seen walking through the doorway, entering the main area of the venue for the social event. The setting is casual and inviting, with warm lighting.

Stefan Keller presenting ongoing research on in introducing created by Claudio Bertozzi and an improved forked version of

A slide from Stefan Keller's presentation at State of the Map 2024 titled "Catching OSM Up with External Data with a Workflow and Tools for Conflation and Validation." The slide outlines the motivation for the talk, focusing on enhancing OpenStreetMap (OSM) through conflation and validation, showcasing interesting OSM activities, and introducing tools like OSM Conflator and DiffedPlaces. The slide includes an overview of the topics covered and a small portrait of Stefan Keller.
ALT text

A slide from Stefan Keller's presentation at State of the Map 2024 titled "Catching OSM Up with External Data with a Workflow and Tools for Conflation and Validation." The slide outlines the motivation for the talk, focusing on enhancing OpenStreetMap (OSM) through conflation and validation, showcasing interesting OSM activities, and introducing tools like OSM Conflator and DiffedPlaces. The slide includes an overview of the topics covered and a small portrait of Stefan Keller.

A slide titled "Conflation in OSM: A general workflow," providing a step-by-step guide to the conflation process. Steps include discussing the import, mapping external data to OSM schema, validating data, calculating differences, and performing the import using tools like JOSM. The slide includes a portrait of Stefan Keller in the bottom right.
ALT text

A slide titled "Conflation in OSM: A general workflow," providing a step-by-step guide to the conflation process. Steps include discussing the import, mapping external data to OSM schema, validating data, calculating differences, and performing the import using tools like JOSM. The slide includes a portrait of Stefan Keller in the bottom right.

A slide discussing "DiffedPlaces," a work-in-progress tool created as part of a master's thesis in data science by Claudio Bertozzi. The slide outlines the goals of DiffedPlaces, including implementing map matching algorithms with machine learning, calculating diffs for OSM data, and showcasing these diffs as GeoJSON on a public website. The slide includes a portrait of Stefan Keller.
ALT text

A slide discussing "DiffedPlaces," a work-in-progress tool created as part of a master's thesis in data science by Claudio Bertozzi. The slide outlines the goals of DiffedPlaces, including implementing map matching algorithms with machine learning, calculating diffs for OSM data, and showcasing these diffs as GeoJSON on a public website. The slide includes a portrait of Stefan Keller.

A slide titled "OSM Conflator: The data flow (and workflow)" depicting a flowchart illustrating the process of matching external data to OSM using the OSM Conflator tool. The diagram shows the steps involved, from data matching to validation and upload to OSM. The slide includes a small portrait of Stefan Keller.
ALT text

A slide titled "OSM Conflator: The data flow (and workflow)" depicting a flowchart illustrating the process of matching external data to OSM using the OSM Conflator tool. The diagram shows the steps involved, from data matching to validation and upload to OSM. The slide includes a small portrait of Stefan Keller.

Mateusz Konieczny presenting all what the does to support without controlling the and its vibrant

Mateusz Konieczny stands at a podium, holding a microphone during his presentation at State of the Map 2024. He is wearing a light gray shirt with a blue lanyard, speaking in front of a projected slide that lists various ways the OpenStreetMap Foundation (OSMF) supports the community, including official OSM forums, mailing lists, and fundraising. The background includes colorful geometric designs and a modern projector setup.
ALT text

Mateusz Konieczny stands at a podium, holding a microphone during his presentation at State of the Map 2024. He is wearing a light gray shirt with a blue lanyard, speaking in front of a projected slide that lists various ways the OpenStreetMap Foundation (OSMF) supports the community, including official OSM forums, mailing lists, and fundraising. The background includes colorful geometric designs and a modern projector setup.

Mateusz Konieczny continues his presentation on stage, with a slide behind him reading, "Dooacracy: OSMF is not some company where board members have legions of staff following their orders." He stands in front of a podium, addressing the audience, with a map of Kenya in the background, decorated with dots and colorful geometric shapes. The stage setup includes chairs and a projector.
ALT text

Mateusz Konieczny continues his presentation on stage, with a slide behind him reading, "Dooacracy: OSMF is not some company where board members have legions of staff following their orders." He stands in front of a podium, addressing the audience, with a map of Kenya in the background, decorated with dots and colorful geometric shapes. The stage setup includes chairs and a projector.

thanks to the local technical team broadcasting the event from to the remote !

A shot from the back of the auditorium showing the stage, with a speaker presenting on a large screen that reads “General Meetings, including elections.” The camera on a tripod in the foreground is capturing the event for a live broadcast. The auditorium's red seats are arranged in rows leading down to the stage, with attendees scattered throughout. The venue is the "Chandaria Centre for Performing Arts," as indicated by the signage on the wall.
ALT text

A shot from the back of the auditorium showing the stage, with a speaker presenting on a large screen that reads “General Meetings, including elections.” The camera on a tripod in the foreground is capturing the event for a live broadcast. The auditorium's red seats are arranged in rows leading down to the stage, with attendees scattered throughout. The venue is the "Chandaria Centre for Performing Arts," as indicated by the signage on the wall.

A group of four men sitting at a technical desk in an auditorium, each working on laptops and screens. Several monitors display the broadcast of the event onstage. One of the men smiles at the camera, flashing a peace sign. Behind them are rows of empty red seats, as they work from the control area of the venue.
ALT text

A group of four men sitting at a technical desk in an auditorium, each working on laptops and screens. Several monitors display the broadcast of the event onstage. One of the men smiles at the camera, flashing a peace sign. Behind them are rows of empty red seats, as they work from the control area of the venue.

A camera set up on a tripod in the auditorium, positioned to capture the event happening onstage. In the background, a few attendees are seated, and the walls feature wood paneling with a sleek, modern design. Some people in the audience are focused on their phones.
ALT text

A camera set up on a tripod in the auditorium, positioned to capture the event happening onstage. In the background, a few attendees are seated, and the walls feature wood paneling with a sleek, modern design. Some people in the audience are focused on their phones.

yesterday Michael Montani introduced to tools to improve and skills based on the specific course about it mappers.un.org/learning

Osmose (an OpenStreetMap validation tool) is displayed on a screen during a presentation. The left side of the screen shows a list of mapping issues, including broken highways, duplicate geometry, and bad tags, marked with different colored dots indicating their severity. The right side of the screen shows a map of Nairobi, Kenya, with roads and various markers, highlighting areas needing attention.
ALT text

Osmose (an OpenStreetMap validation tool) is displayed on a screen during a presentation. The left side of the screen shows a list of mapping issues, including broken highways, duplicate geometry, and bad tags, marked with different colored dots indicating their severity. The right side of the screen shows a map of Nairobi, Kenya, with roads and various markers, highlighting areas needing attention.

Attendees seated in a lecture hall with red cushioned seats. Michael Montani, the presenter, is not visible, but participants are engaged, some using laptops while others listen. The room is sparsely filled, and a whiteboard is visible at the back of the room. The atmosphere suggests focused attention during a presentation.
ALT text

Attendees seated in a lecture hall with red cushioned seats. Michael Montani, the presenter, is not visible, but participants are engaged, some using laptops while others listen. The room is sparsely filled, and a whiteboard is visible at the back of the room. The atmosphere suggests focused attention during a presentation.

yesterday Anastazia Caroll told her journey as a , how she went beyond her fears of not being technical enough to embrace and and how she enjoyed to improve her skills and being able to deliver strong products now

Anastazia Caroll is standing at a podium, delivering a presentation. She is wearing glasses and a lanyard, speaking into a microphone. Behind her, part of a slide is projected on the screen, featuring colorful upward-pointing arrows and the text, "Direct Contribution in Projects and Creating Fieldwork Flow."
ALT text

Anastazia Caroll is standing at a podium, delivering a presentation. She is wearing glasses and a lanyard, speaking into a microphone. Behind her, part of a slide is projected on the screen, featuring colorful upward-pointing arrows and the text, "Direct Contribution in Projects and Creating Fieldwork Flow."

A slide projected on a screen titled "Milestone" features three key points: "Personal Growth," "Direct Contribution in Projects and Creating Fieldwork Flow," and "Networking and Community Engagement." The slide has a playful design with colorful shapes and a cartoon figure climbing up red and blue arrows, symbolizing progress and achievement.
ALT text

A slide projected on a screen titled "Milestone" features three key points: "Personal Growth," "Direct Contribution in Projects and Creating Fieldwork Flow," and "Networking and Community Engagement." The slide has a playful design with colorful shapes and a cartoon figure climbing up red and blue arrows, symbolizing progress and achievement.

yesterday Yvonne Darko told how she organized a street views collection in her village to map pharmacies and addresses in . I like she used to host the pictures

A presentation slide titled "Methodology" outlines steps taken by Yvonne Darko in her street views collection project. The slide lists actions like taking images, using metadata to map on OSM, filling in house numbers and street names, saving images on Wikimedia Commons, and using an open license. A large Wikimedia Commons logo is displayed on the right. A small image of Yvonne Darko speaking is visible in the bottom-right corner of the slide.
ALT text

A presentation slide titled "Methodology" outlines steps taken by Yvonne Darko in her street views collection project. The slide lists actions like taking images, using metadata to map on OSM, filling in house numbers and street names, saving images on Wikimedia Commons, and using an open license. A large Wikimedia Commons logo is displayed on the right. A small image of Yvonne Darko speaking is visible in the bottom-right corner of the slide.

🛣️ 611 km de rues cumulées
📸 97900 photos prises sur 57 heures (dont 35h à vélo et 22h à pied)
🎬 78 séquences
🕝 20 jours de capture étalés sur 5 semaines
🌳 5 coulées vertes et bord de rivière capturés
🎓 1 campus universitaire et 🏰 1 château capturé

La commune de Nantes (et un peu Carquefou) a désormais bien plus de rues en 360° qu'avant, même s'il reste beaucoup de travail !

Merci à @naomap (de @cartocite) pour le prêt du kit mobile !

api.panoramax.xyz/#focus=map&m

GIF animé d'une carte OpenStreetMap de Nantes, avec la couverture Panoramax en 360 degrés. Première image : une petite partie du centre-ville est en 360 degrés. Deuxième image : Une plus grande partie du centre-ville de Nantes, et le nord est disponible en 360 degrés !
ALT text

GIF animé d'une carte OpenStreetMap de Nantes, avec la couverture Panoramax en 360 degrés. Première image : une petite partie du centre-ville est en 360 degrés. Deuxième image : Une plus grande partie du centre-ville de Nantes, et le nord est disponible en 360 degrés !

Introducing another based alternative to in order to find (and ) restaurants on mobile devices via .

Available via and the stores listed on their homepage: osmand.net/

The screenshots show German dialogues, but I provide an English description in the alt texts.

1/2

OSMand screenshot with indications, which translate to:

Step 1: Click on the search icon (upper left corner in map view, next to map configuration).
ALT text

OSMand screenshot with indications, which translate to: Step 1: Click on the search icon (upper left corner in map view, next to map configuration).

OSMand screenshot with indications, which translate to:

Step 1: Click on the search icon (upper left corner in map view, next to map configuration).
ALT text

OSMand screenshot with indications, which translate to: Step 1: Click on the search icon (upper left corner in map view, next to map configuration).

OSMand screenshot with indications, which translate to:

Step 1: Click on the search icon (upper left corner in map view, next to map configuration).
ALT text

OSMand screenshot with indications, which translate to: Step 1: Click on the search icon (upper left corner in map view, next to map configuration).

OSMand screenshot with indications, which translate to:

Step 2: select category tab
Step 3: choose cafe and restaurants
ALT text

OSMand screenshot with indications, which translate to: Step 2: select category tab Step 3: choose cafe and restaurants

OSMand screenshot with indications, which translate to:

Step 4: Click on the filter icon
ALT text

OSMand screenshot with indications, which translate to: Step 4: Click on the filter icon

OSMand screenshot with indications, which translate to:

Step 2: select category tab
Step 3: choose cafe and restaurants
ALT text

OSMand screenshot with indications, which translate to: Step 2: select category tab Step 3: choose cafe and restaurants

OSMand screenshot with indications, which translate to:

Step 4: Click on the filter icon
ALT text

OSMand screenshot with indications, which translate to: Step 4: Click on the filter icon

OSMand screenshot with indications, which translate to:

Step 1: Click on the search icon (upper left corner in map view, next to map configuration).
ALT text

OSMand screenshot with indications, which translate to: Step 1: Click on the search icon (upper left corner in map view, next to map configuration).

OSMand screenshot with indications, which translate to:

Step 1: Click on the search icon (upper left corner in map view, next to map configuration).
ALT text

OSMand screenshot with indications, which translate to: Step 1: Click on the search icon (upper left corner in map view, next to map configuration).

OSMand screenshot with indications, which translate to:

Step 2: select category tab
Step 3: choose cafe and restaurants
ALT text

OSMand screenshot with indications, which translate to: Step 2: select category tab Step 3: choose cafe and restaurants

OSMand screenshot with indications, which translate to:

Step 2: select category tab
Step 3: choose cafe and restaurants
ALT text

OSMand screenshot with indications, which translate to: Step 2: select category tab Step 3: choose cafe and restaurants

OSMand screenshot with indications, which translate to:

Step 1: Click on the search icon (upper left corner in map view, next to map configuration).
ALT text

OSMand screenshot with indications, which translate to: Step 1: Click on the search icon (upper left corner in map view, next to map configuration).

OSMand screenshot with indications, which translate to:

Step 1: Click on the search icon (upper left corner in map view, next to map configuration).
ALT text

OSMand screenshot with indications, which translate to: Step 1: Click on the search icon (upper left corner in map view, next to map configuration).

OSMand screenshot with indications, which translate to:

Step 4: Click on the filter icon
ALT text

OSMand screenshot with indications, which translate to: Step 4: Click on the filter icon

OSMand screenshot with indications, which translate to:

Step 4: Click on the filter icon
ALT text

OSMand screenshot with indications, which translate to: Step 4: Click on the filter icon

OSMand screenshot with indications, which translate to:

Step 2: select category tab
Step 3: choose cafe and restaurants
ALT text

OSMand screenshot with indications, which translate to: Step 2: select category tab Step 3: choose cafe and restaurants

OSMand screenshot with indications, which translate to:

Step 2: select category tab
Step 3: choose cafe and restaurants
ALT text

OSMand screenshot with indications, which translate to: Step 2: select category tab Step 3: choose cafe and restaurants

OSMand screenshot with indications, which translate to:

Step 2: select category tab
Step 3: choose cafe and restaurants
ALT text

OSMand screenshot with indications, which translate to: Step 2: select category tab Step 3: choose cafe and restaurants

OSMand screenshot with indications, which translate to:

Step 4: Click on the filter icon
ALT text

OSMand screenshot with indications, which translate to: Step 4: Click on the filter icon

OSMand screenshot with indications, which translate to:

Step 4: Click on the filter icon
ALT text

OSMand screenshot with indications, which translate to: Step 4: Click on the filter icon

OSMand screenshot with indications, which translate to:

Step 4: Click on the filter icon
ALT text

OSMand screenshot with indications, which translate to: Step 4: Click on the filter icon

Previously I compared to in Latvia.
mastodon.social/@richlv/111402

Ended up on from a website, and it didn't seem to depict reality. Had to compare it with OSM.

Missing major buildings, roads. Incorrect roads (NE one is a mostly a path). And that's ignoring all the detail, available in OSM.

Oh, and that "bar" on the left in Google Maps? That's a spam entry, advertising bar services for events.

Ce style cartographique (basé sur les données ) qui se concentre sur le paysage urbain est magnifique 🤩

🖥 Le code source : github.com/SupaplexOSM/strasse

🗺 Un superbe exemple en ligne : strassenraumkarte.osm-berlin.o

Thanks @Supaplex030 🙏

vue du ciel d'un carrefour avec beaucoup de détails
ALT text

vue du ciel d'un carrefour avec beaucoup de détails

vue du ciel d'un carrefour avec beaucoup de détails
ALT text

vue du ciel d'un carrefour avec beaucoup de détails


I live in Madison (WI). In my day job, I'm a mixed-methods health researcher (pediatrics and prevention research). Passionate about 🚲, walking, 🚌🚆, landuse. Co-founder and president of local bike advocacy group Madison Bikes, and I serve on the City of Madison Transportation Commission. I use at work and for advocacy (and entertainment). Long-time contributor to I have a data blog at haraldkliems.netlify.app/

haraldkliems.netlify.app

Harald Kliems

Hallo Fediversum!

Obwohl ich bereits einen Account auf @[email protected] hatte, bin ich . 👋

: Als an einer 🎓Fachhochschule 👨‍🏫betreue ich Übungen & 👩‍🔧Praktika, 👨‍💻entwickle und 👨‍🔬betreibe angewandte "". In meiner Freizeit trage ich zu 🗺️ bei und lerne & spreche 💚. Ich interessiere mich für & |n wie und für das :jugend_hackt: Beibringen des |s.